Fig. 12.
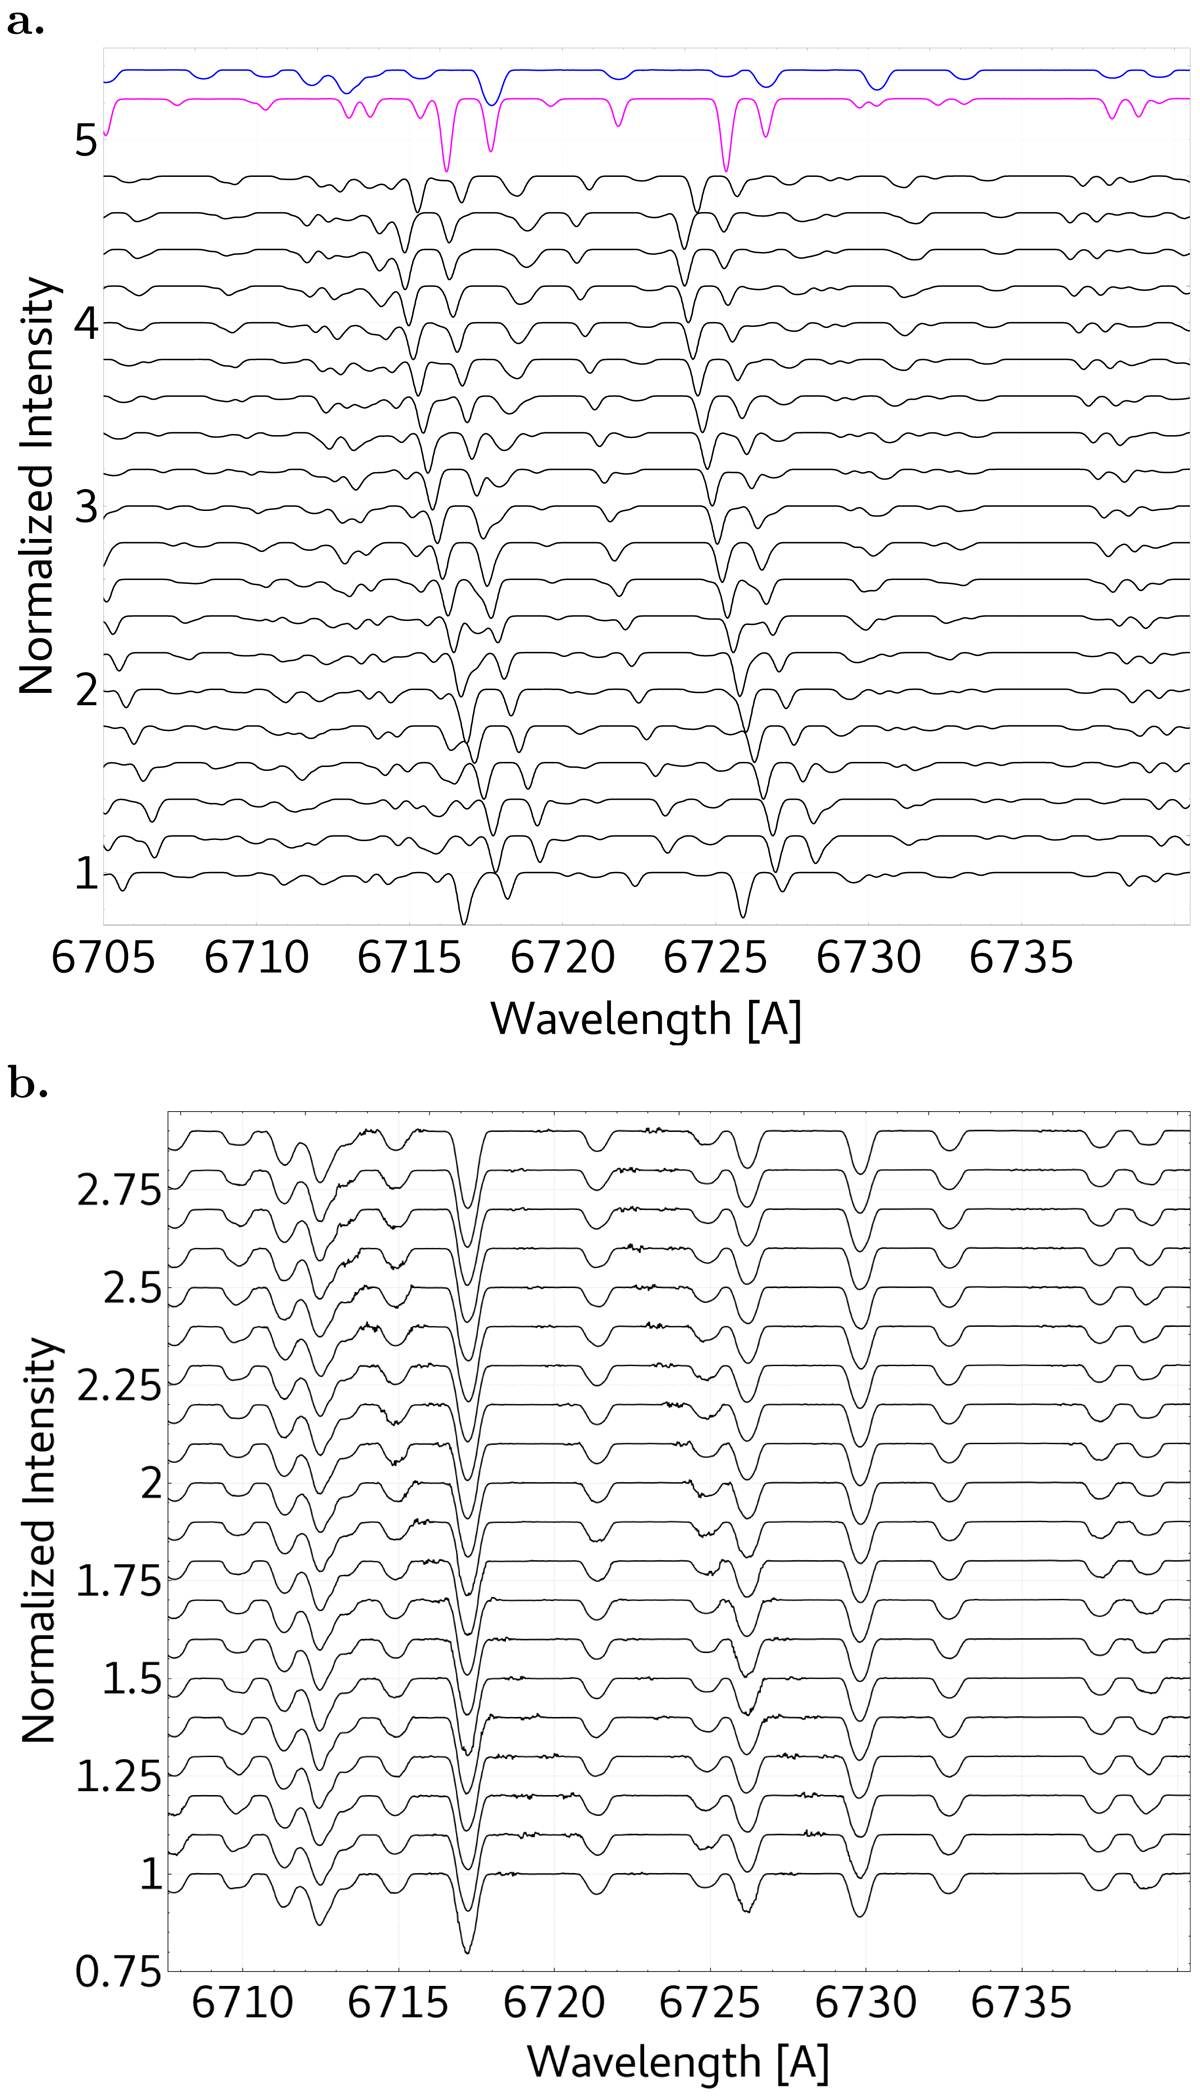
Panel a: artificial data set of SB2 system with a spot on the broad-lined component. Disentangled profiles renormalized to one are shown at the top in blue and purple. Panel b: disentangled spectrum of the sharp-lined component is subtracted from the composite spectra and the result is shifted to the rest wavelength. These spectra were used to create the Doppler maps shown in Fig. 15c.
Current usage metrics show cumulative count of Article Views (full-text article views including HTML views, PDF and ePub downloads, according to the available data) and Abstracts Views on Vision4Press platform.
Data correspond to usage on the plateform after 2015. The current usage metrics is available 48-96 hours after online publication and is updated daily on week days.
Initial download of the metrics may take a while.