Free Access
Fig. 1.
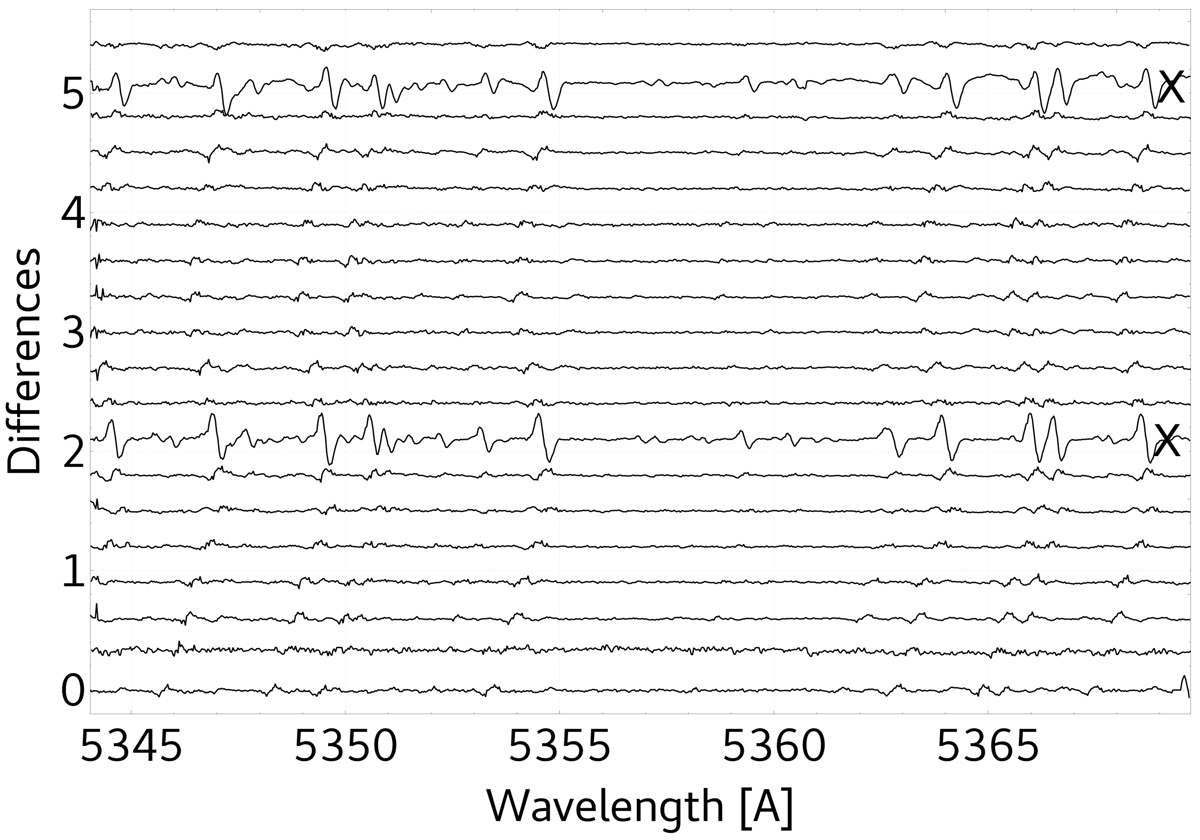
Example of the differences between the disentangled spectra and 19 individual observations of Capella. The optimization has failed to find proper RV values for two spectra, which can be seen by the strong differences (black crosses). The spectra have been shifted by 0.3 on the y-axis for better visibility.
Current usage metrics show cumulative count of Article Views (full-text article views including HTML views, PDF and ePub downloads, according to the available data) and Abstracts Views on Vision4Press platform.
Data correspond to usage on the plateform after 2015. The current usage metrics is available 48-96 hours after online publication and is updated daily on week days.
Initial download of the metrics may take a while.