Free Access
Fig. 8
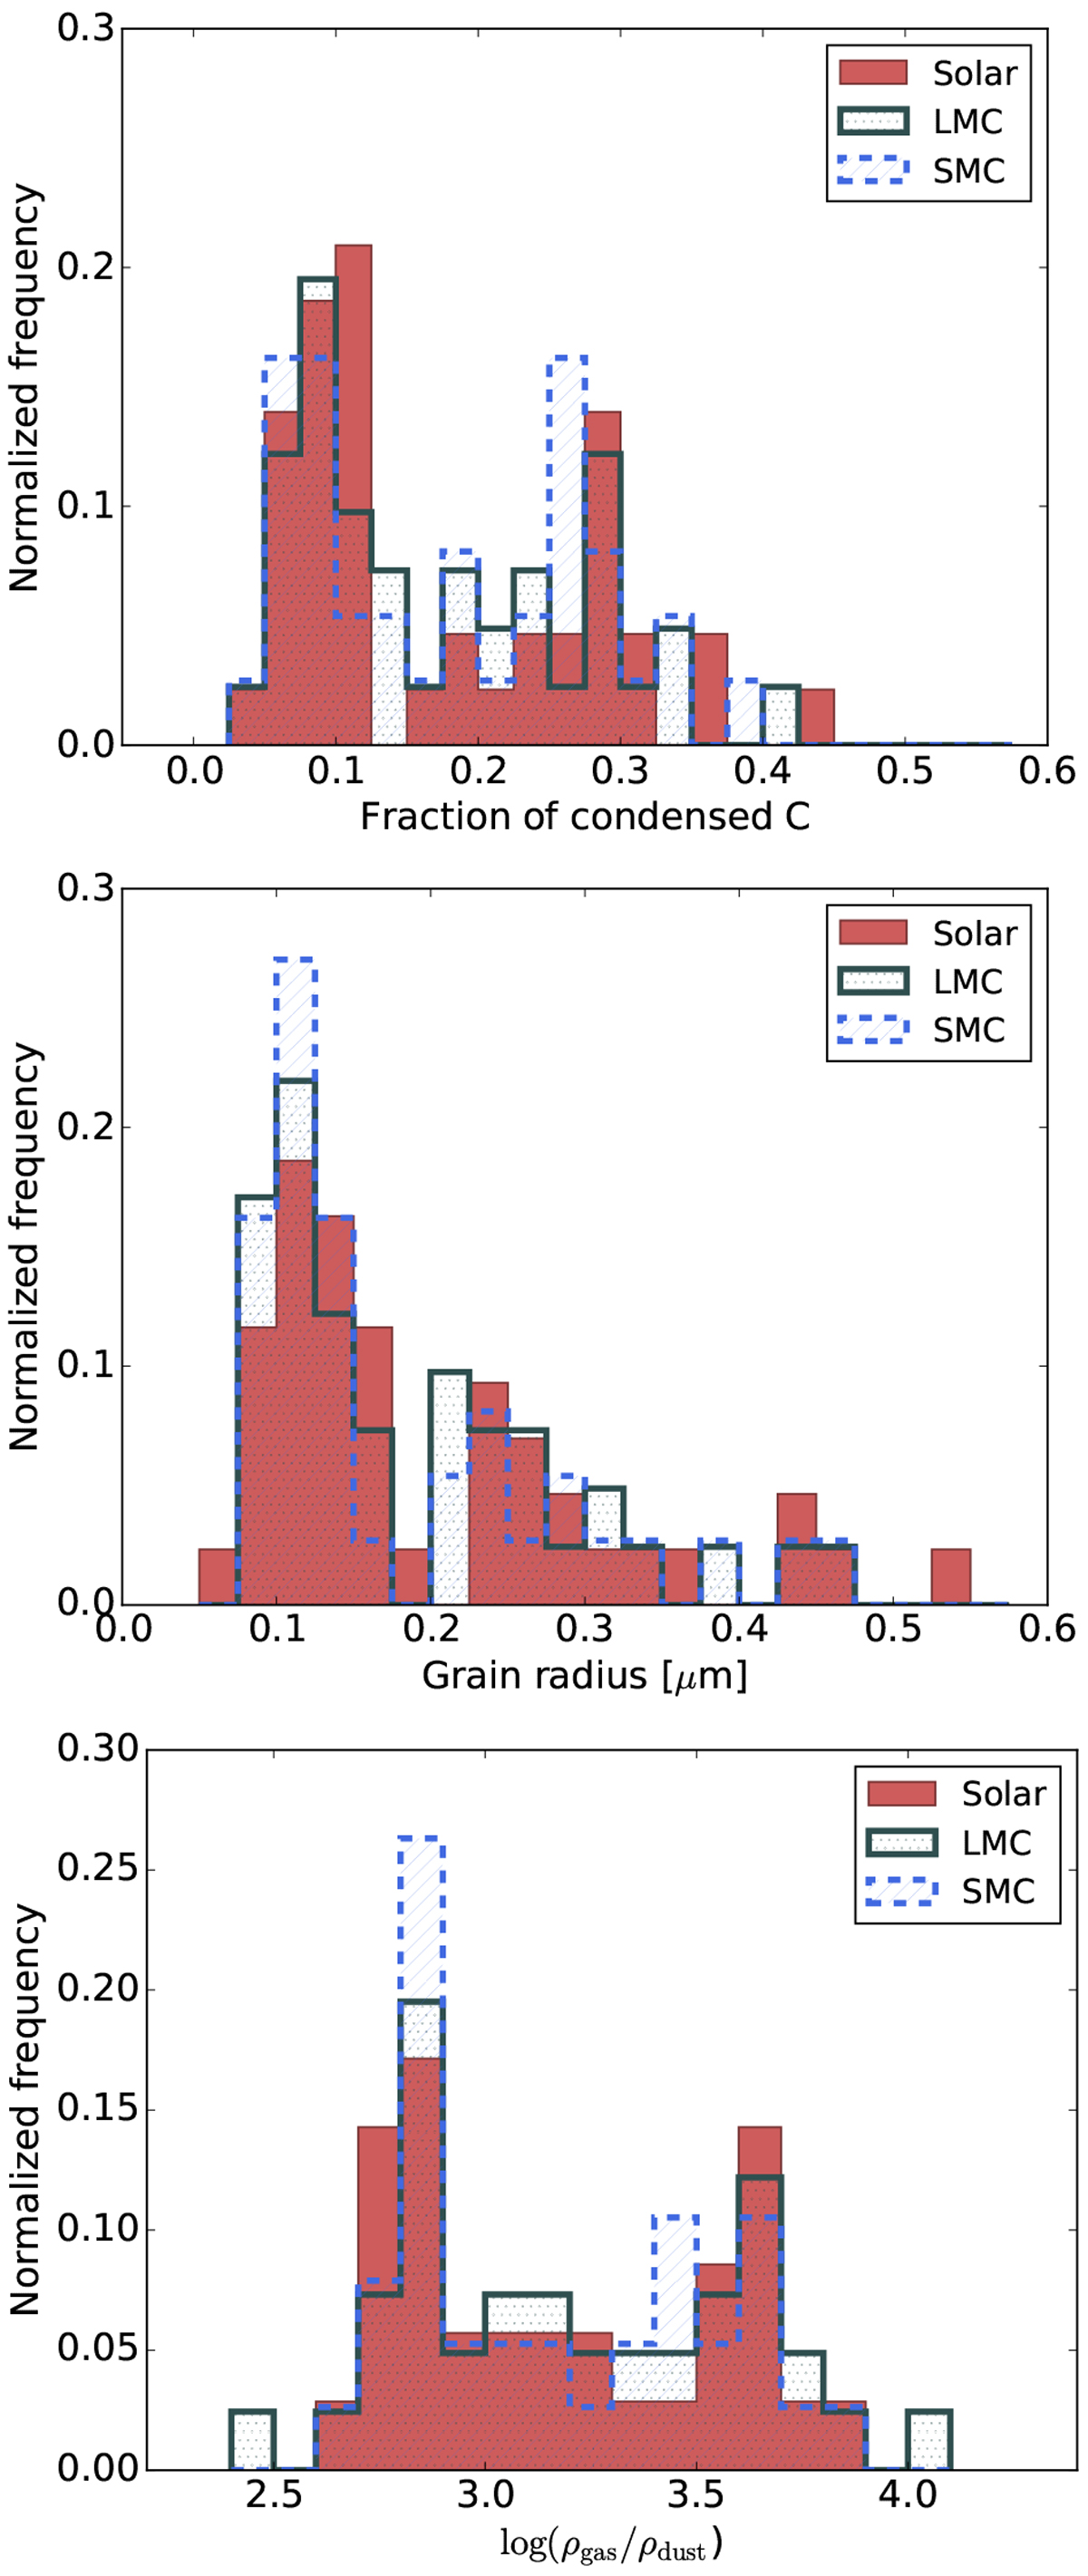
Degree of condensed carbon (upper panel), grain sizes (middle panel) and gas-to-dust mass ratios (lower panel) in the outermost atmospheric layers, averaged over time, for all models that develop a wind (indicated in red in Fig. 3). The histograms are color-coded according to different metallicities.
Current usage metrics show cumulative count of Article Views (full-text article views including HTML views, PDF and ePub downloads, according to the available data) and Abstracts Views on Vision4Press platform.
Data correspond to usage on the plateform after 2015. The current usage metrics is available 48-96 hours after online publication and is updated daily on week days.
Initial download of the metrics may take a while.