Free Access
Fig. 5
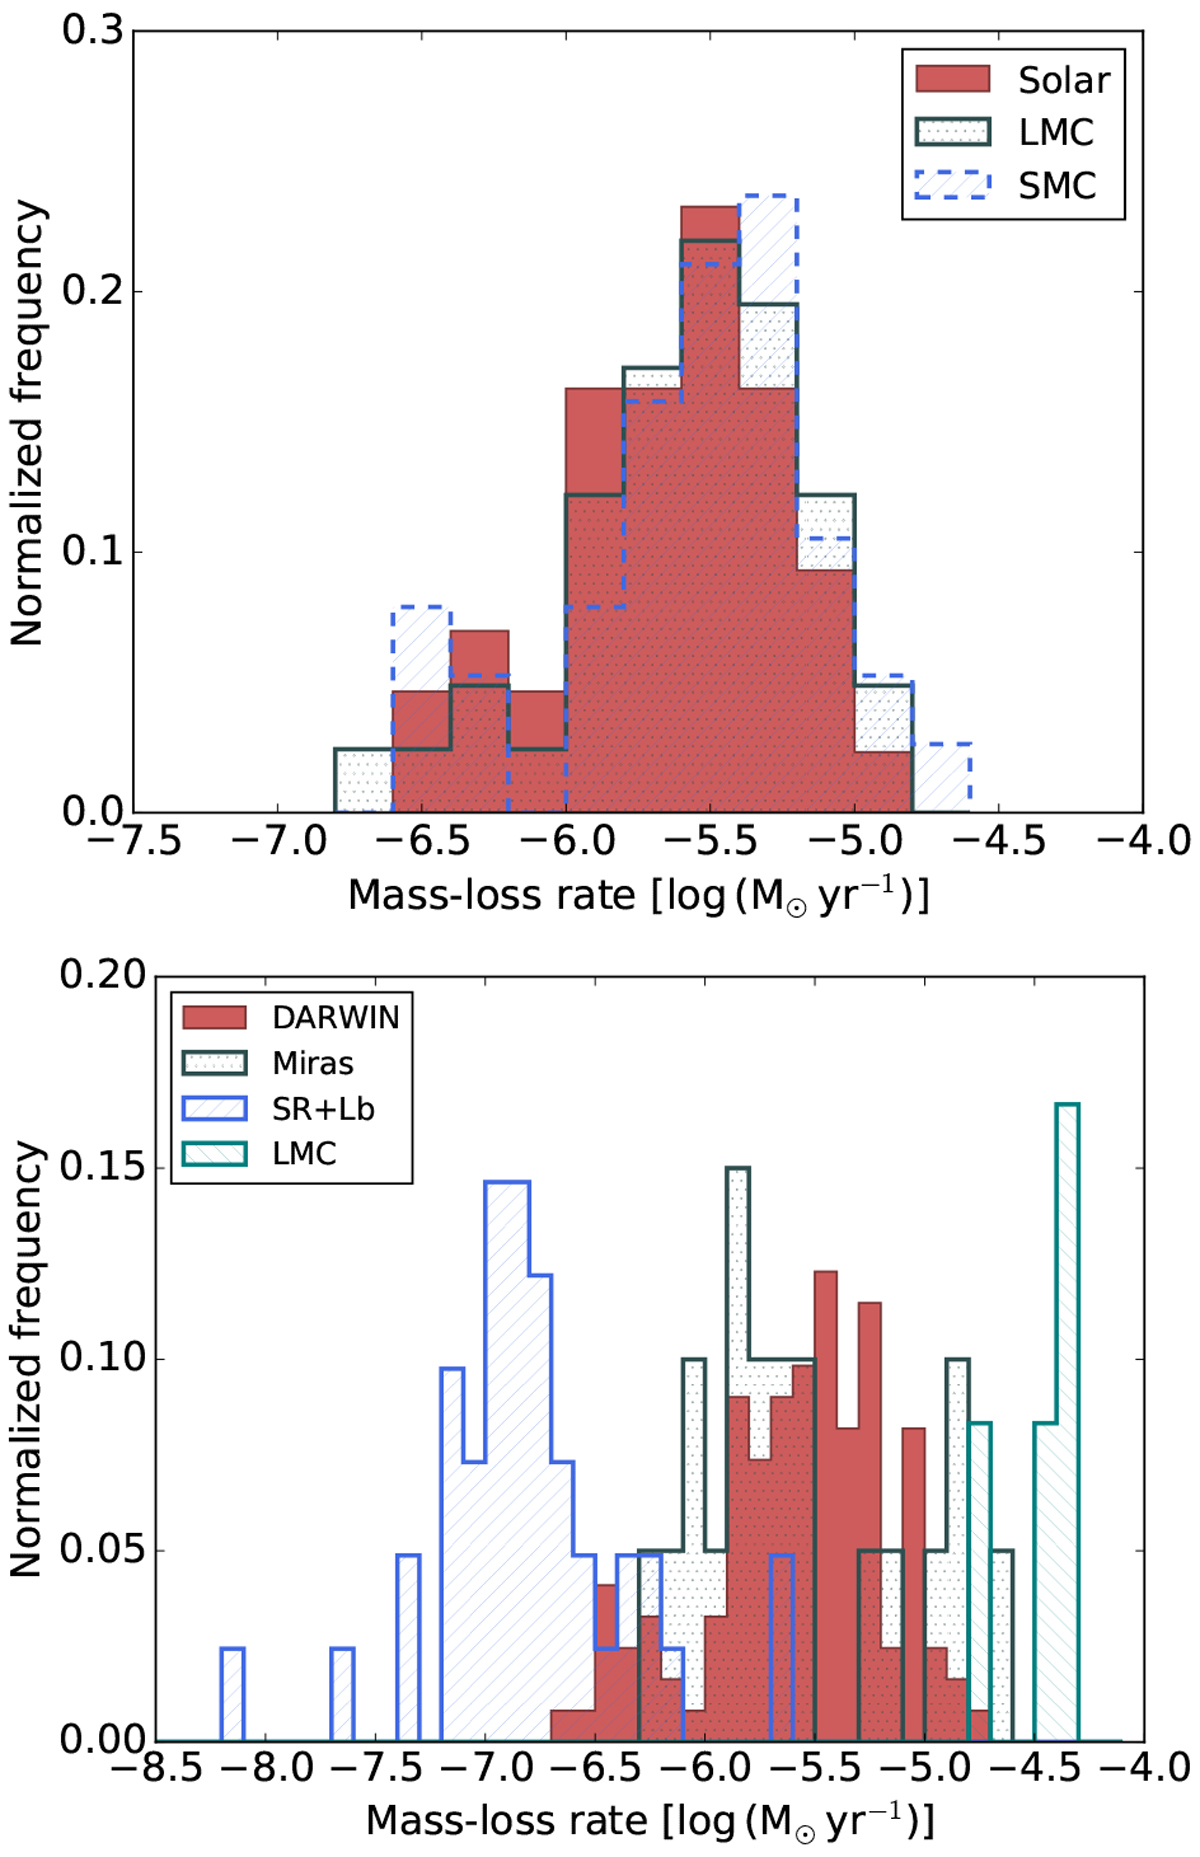
Mass-loss rates for all models that develop a wind (indicated in red in Fig. 3). Upper panel: model values sorted according to metallicity. Lower panel: observational and model data. The frequency for the observational LMC data is divided by 3 to fit in the plot without losing details from the other observational sets.
Current usage metrics show cumulative count of Article Views (full-text article views including HTML views, PDF and ePub downloads, according to the available data) and Abstracts Views on Vision4Press platform.
Data correspond to usage on the plateform after 2015. The current usage metrics is available 48-96 hours after online publication and is updated daily on week days.
Initial download of the metrics may take a while.