Fig. 3.
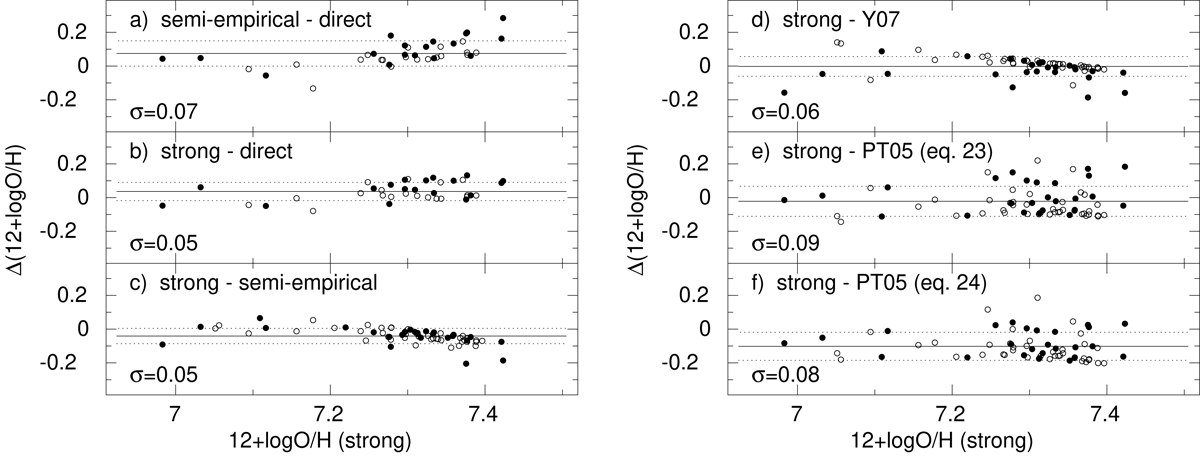
Panel a: distribution of differences between oxygen abundances 12 + log O/H derived by the semi-empirical and the direct methods for the sample from Table A.2 excluding galaxies with non-detected [O III]λ4363 Å emission lines. Panel b: as in panel a but for differences between 12 + log O/H derived by our new strong-line and the direct methods. Panel c: as in panel a but for differences between 12 + log O/H derived by the strong-line and the semi-empirical methods for all SFGs from Table A.2. Panel d: as in panel c but for differences between 12 + log O/H derived by the strong-line method and the strong-line method by Yin et al. (2007). Panel e: as in panel c but for differences between 12 + log O/H derived by the strong-line method and the P-method (Eq. (23) in Pilyugin & Thuan 2005). Panel f: as in panel c but for differences between 12 + log O/H derived by the strong-line method and the P-method (Eq. (24) in Pilyugin & Thuan 2005). In all panels, galaxies with observed and non-observed [O II]λ3727 emission line are shown by filled and open circles, respectively. Solid horizontal lines indicate average abundance differences and dotted horizontal lines indicate ±1σ dispersions of the sample around the average values.
Current usage metrics show cumulative count of Article Views (full-text article views including HTML views, PDF and ePub downloads, according to the available data) and Abstracts Views on Vision4Press platform.
Data correspond to usage on the plateform after 2015. The current usage metrics is available 48-96 hours after online publication and is updated daily on week days.
Initial download of the metrics may take a while.