Fig. 1.
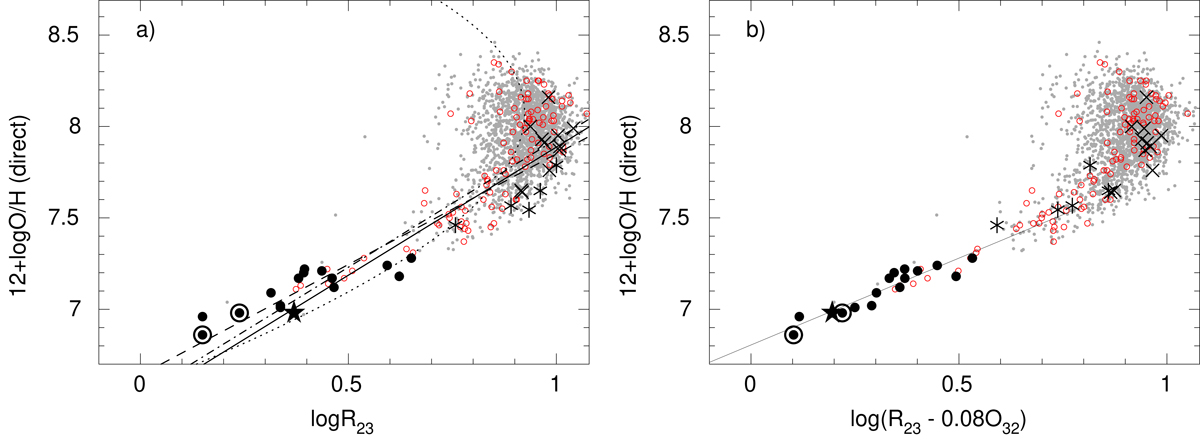
Panel a: (log R23)−(12 + log O/H), and panel b: log (R23 − 0.08O32)−(12 + log O/H) relations. In both these relations 12 + log O/H is derived by the direct method, R23 = ([O III]λ4959+λ5007+[O II]λ3727)/Hβ and O32 = [O III]λ5007/[O II]λ3727. The galaxy J0811+4730 with the lowest luminosity-weighted oxygen abundance (Izotov et al. 2018a) is shown by a filled star, while two knots in SBS 0335−052W with similar or lower oxygen abundances (Izotov et al. 2009) are represented by encircled filled circles. Other lowest-metallicity SFGs from Izotov et al. (2018a), the galaxy Little Cub (Hsyu et al. 2017) and the H II region DDO 68 #7 (Annibali 2019) are shown by filled circles. SFGs with the highest O32 ratios in the range ∼20–40 (Izotov et al. 2017) are shown by asterisks. Samples of SFGs used for the He abundance determination (Izotov et al. 2014a, and references therein) and Lyman continuum leakers (Izotov 2018b, and references therein) are shown by open circles and crosses, respectively. Grey dots represent SDSS SFGs at z > 0.02 from DR9 and earlier releases and at any redshift from DR10 and later releases, with the [O III]λ4363 Å emission line measured with an accuracy better than 25%. The dashed, dotted, solid, and dash-dotted lines in panel a are the empirical relations by Skillman (1989), Nagao et al. (2006), Yin et al. (2007) and Pilyugin (2000), respectively. The solid line in panel b is the linear most likelihood fit to the SDSS data with log (R23 − 0.08O32)≤0.8 (this paper).
Current usage metrics show cumulative count of Article Views (full-text article views including HTML views, PDF and ePub downloads, according to the available data) and Abstracts Views on Vision4Press platform.
Data correspond to usage on the plateform after 2015. The current usage metrics is available 48-96 hours after online publication and is updated daily on week days.
Initial download of the metrics may take a while.