Free Access
Fig. 9.
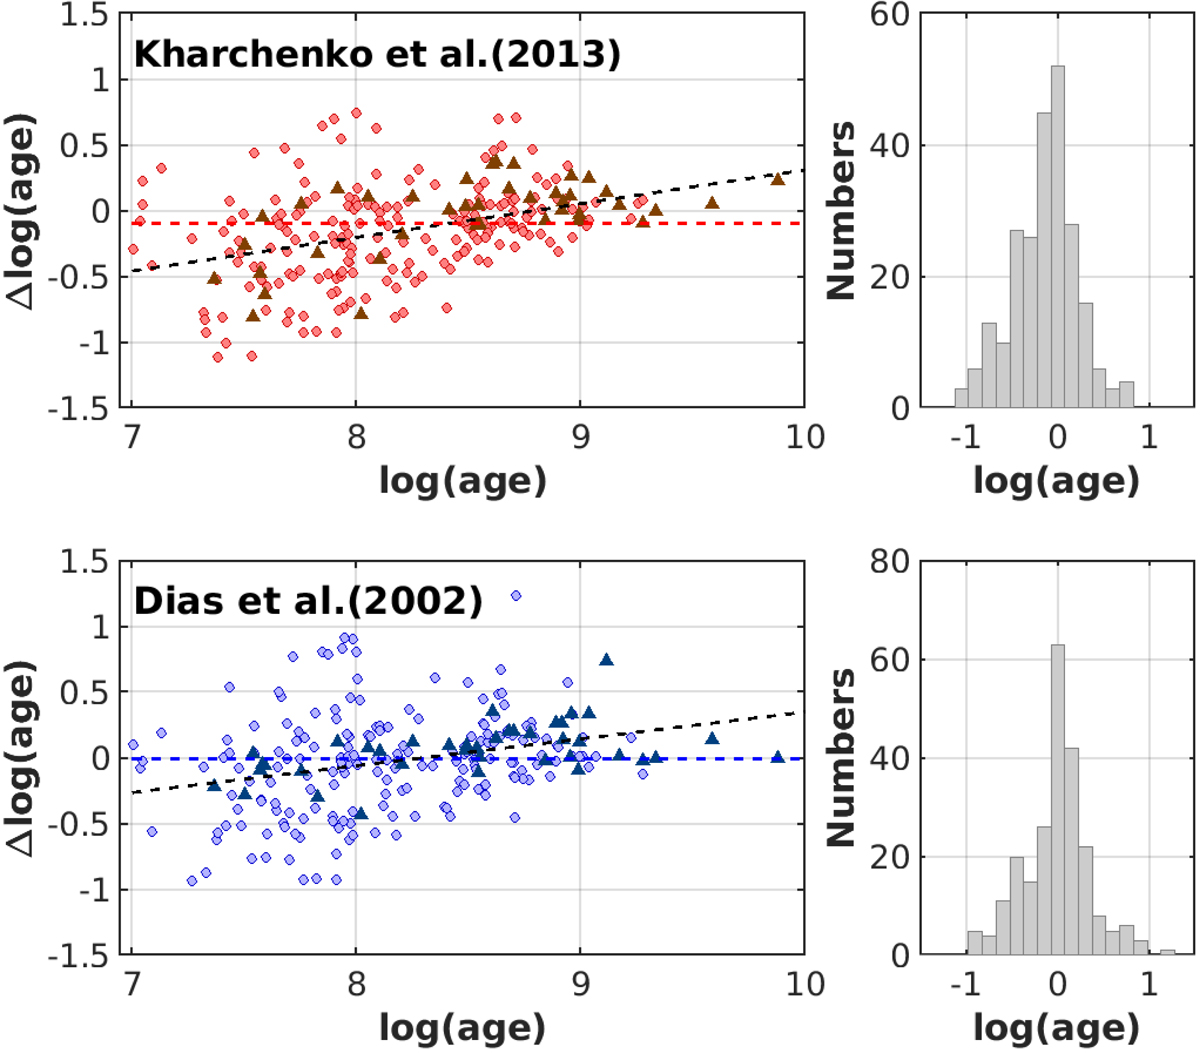
Age differences between our catalog with MWSC (upper panel) and DAML (lower panel). Triangles are clusters with spectroscopic determination of [Fe/H]. Dashed lines correspond to the median deviations. Right panel: histograms (in gray) show the difference in age distribution between our sample and the two catalogs.
Current usage metrics show cumulative count of Article Views (full-text article views including HTML views, PDF and ePub downloads, according to the available data) and Abstracts Views on Vision4Press platform.
Data correspond to usage on the plateform after 2015. The current usage metrics is available 48-96 hours after online publication and is updated daily on week days.
Initial download of the metrics may take a while.