Fig. 2.
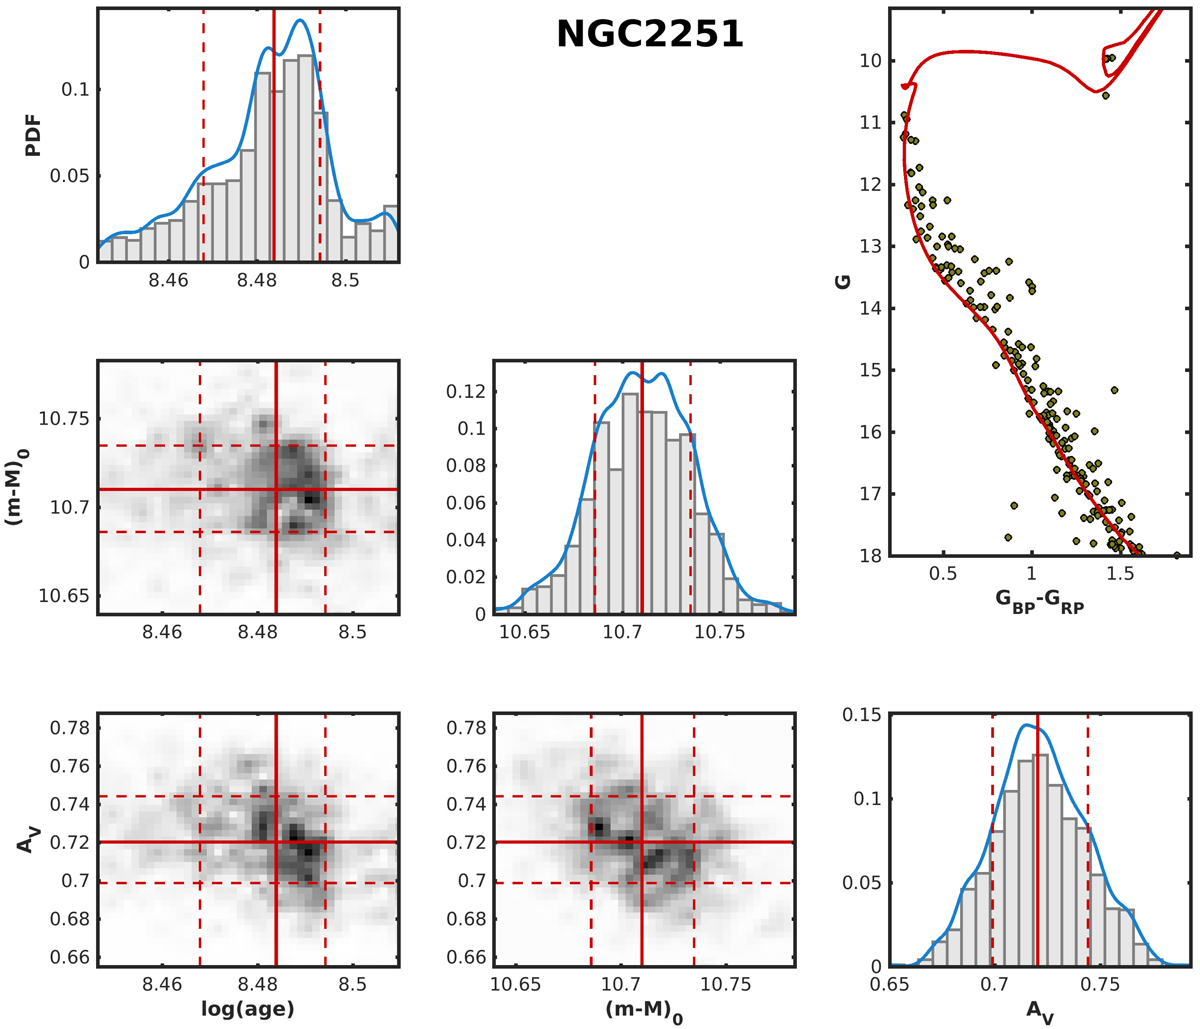
Solutions for NGC 2251. On the three diagonal panels we show the probability distribution functions of the variables with their medians (red solid line) and the 16th and 84th percentiles of the distribution (red dashed lines). The panels with the maps show instead the 2D-probability for each couple of parameters, highlighting possible correlations (e.g., between distance modulus and absorption). Finally, in the top-right panel we present the CMD of the cluster with the isochrone corresponding to the median parameters.
Current usage metrics show cumulative count of Article Views (full-text article views including HTML views, PDF and ePub downloads, according to the available data) and Abstracts Views on Vision4Press platform.
Data correspond to usage on the plateform after 2015. The current usage metrics is available 48-96 hours after online publication and is updated daily on week days.
Initial download of the metrics may take a while.