Fig. 11.
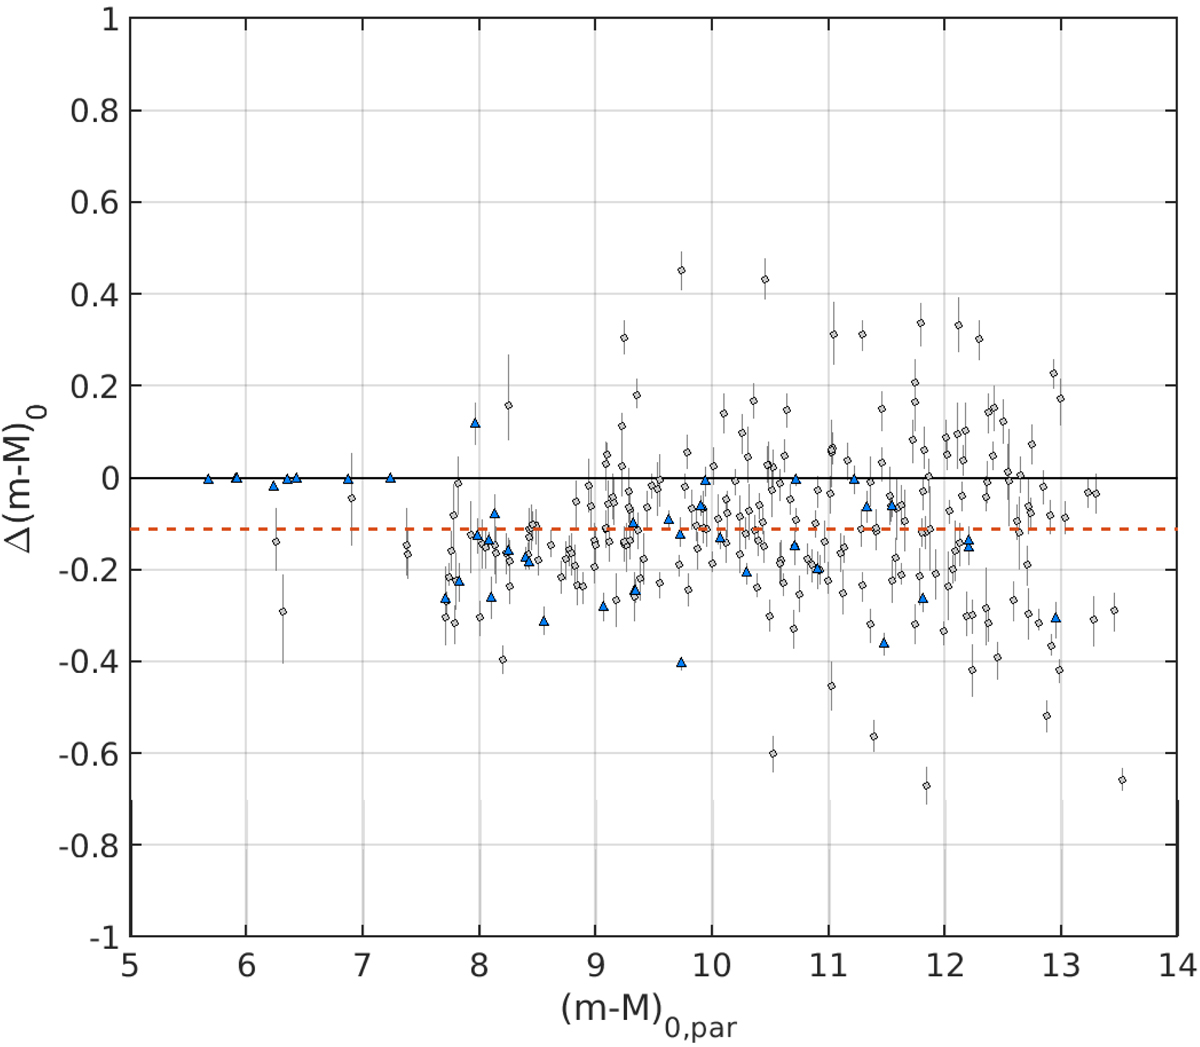
Differences of the distance modulus between posteriors ((m − M)0, med) and priors ((m − M)0, par), where the first have been derived from BASE-9 output and the latter from Eq. (2). Blue triangles are clusters with spectroscopic determination of [Fe/H], while the red dashed line is the median deviation corresponding to Δ(m − M)0, med − par = −0.11 mag.
Current usage metrics show cumulative count of Article Views (full-text article views including HTML views, PDF and ePub downloads, according to the available data) and Abstracts Views on Vision4Press platform.
Data correspond to usage on the plateform after 2015. The current usage metrics is available 48-96 hours after online publication and is updated daily on week days.
Initial download of the metrics may take a while.