Fig. 9.
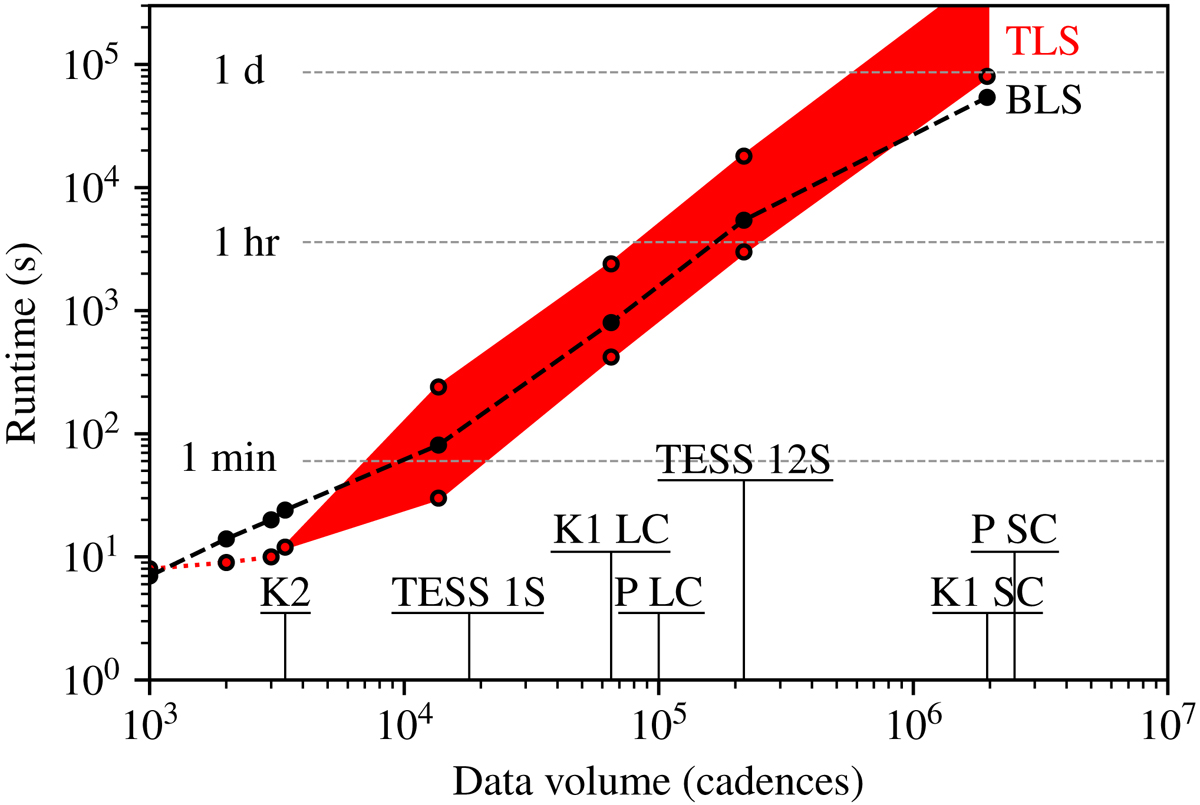
Algorithm run times for different missions, durations, and cadences. Kepler LC (30 min) and SC (1 min) are shown for 4.25 yr worth of data, K2 assumes 80 d of LC data. TESS is represented with one (1S) and twelve (12S) seasons at 2 min cadence, respectively. PLATO light curves are considered over 2 yr in both 25 s short cadence (P SC) and 10 min long cadence (P LC). The red area shows the full range of TLS run times. The upper end assumes no priors on stellar density and fitting signals down to 10 ppm. The lower end assumes typical priors from catalog data and a 100 ppm threshold (or a 1% threshold on phase sampling). In the latter case, run times are shorter than BLS for all but the largest data sets. We note the slope of roughly two orders of magnitude of the run time per order of magnitude of cadences.
Current usage metrics show cumulative count of Article Views (full-text article views including HTML views, PDF and ePub downloads, according to the available data) and Abstracts Views on Vision4Press platform.
Data correspond to usage on the plateform after 2015. The current usage metrics is available 48-96 hours after online publication and is updated daily on week days.
Initial download of the metrics may take a while.