Fig. 8.
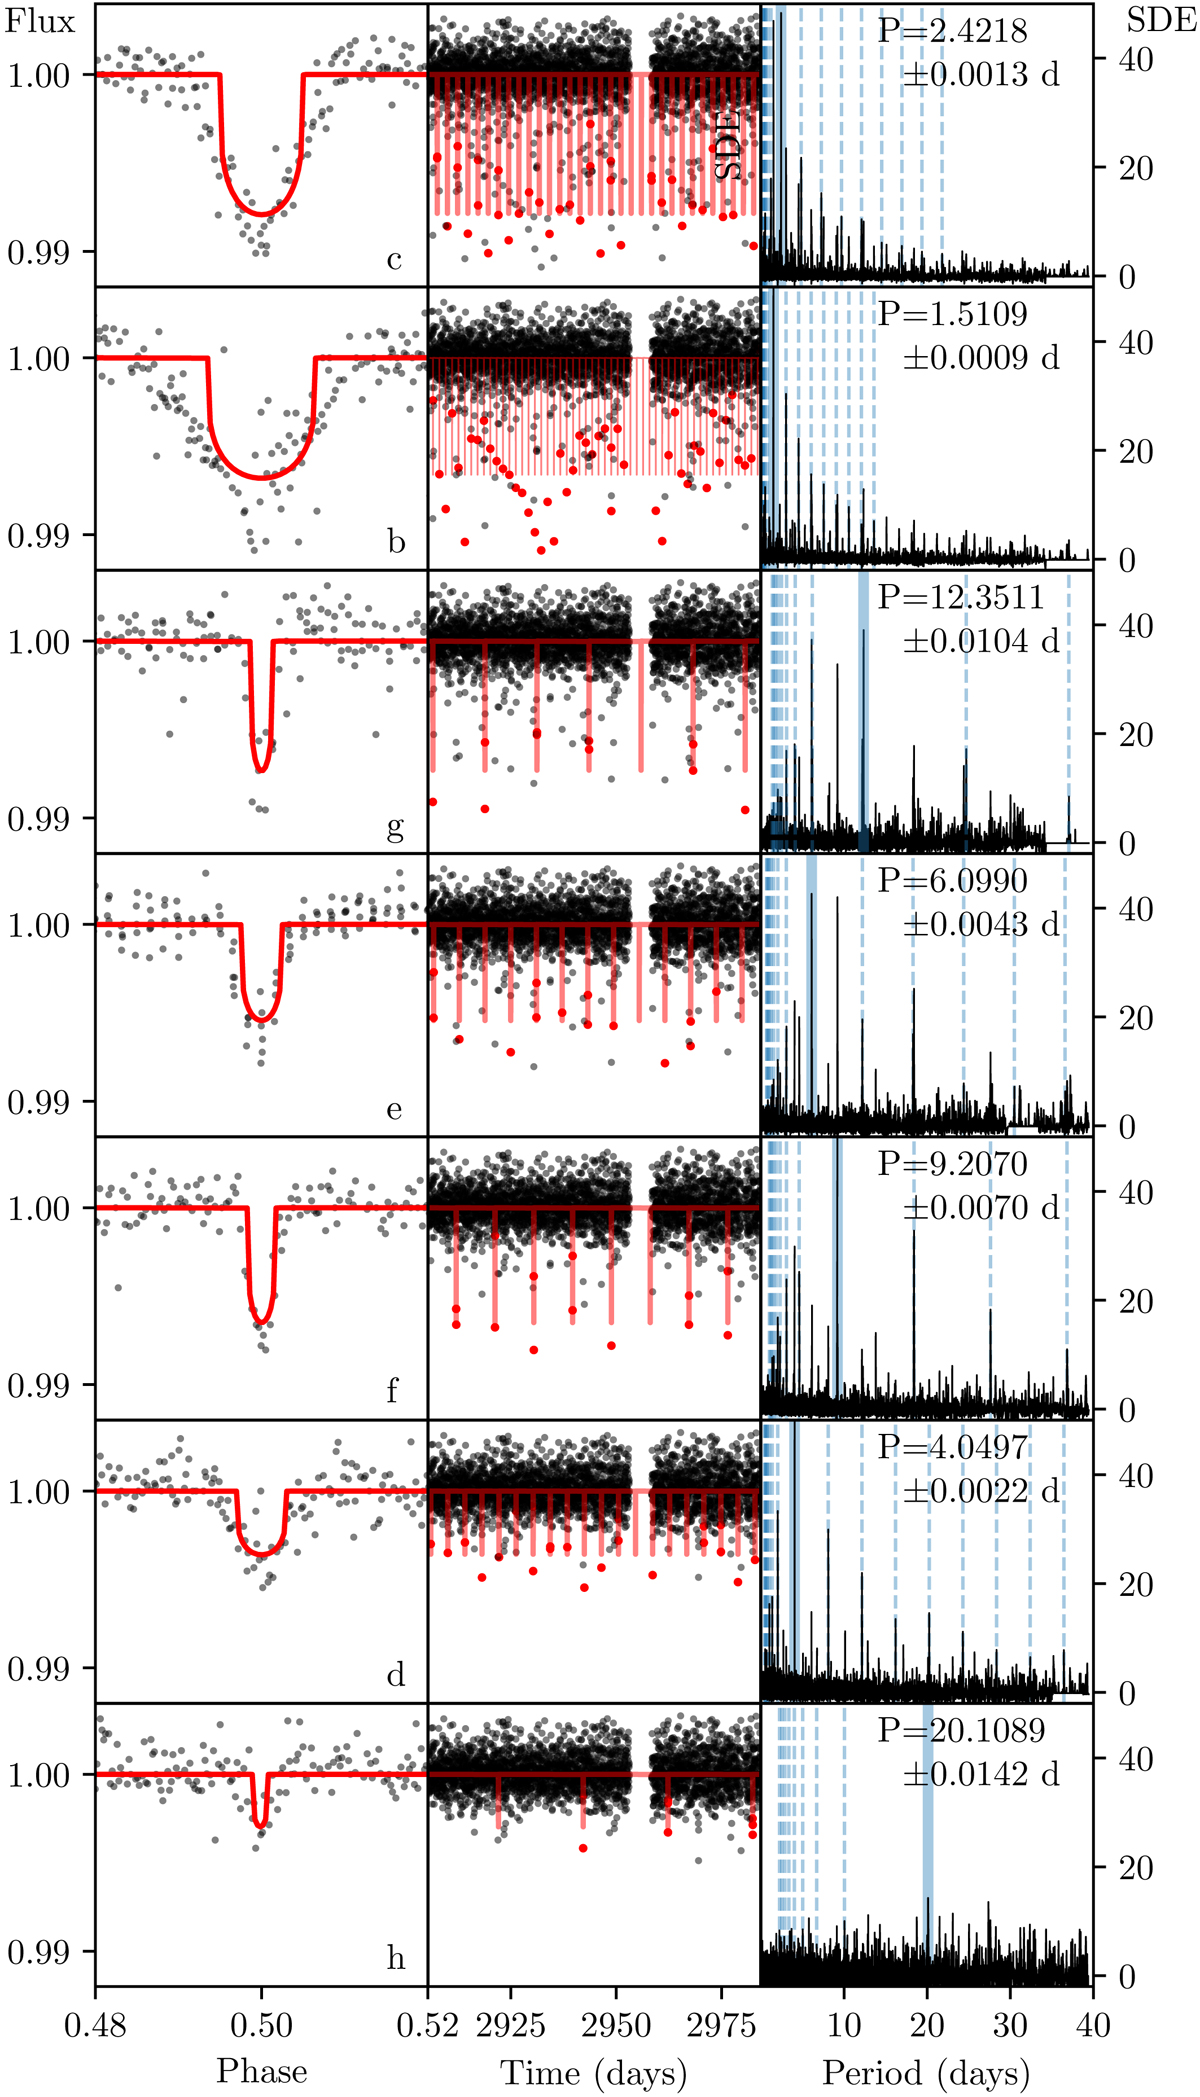
Demonstration of the TLS performance on the TRAPPIST-1 system. Left panels: phase-folded transit light curve for the respective period and epoch at SDE maximum (black dots). The best-fit transit model (fitted for transit duration and depth) with quadratic stellar limb darkening is shown with a red solid line. Planet names are indicated in the lower right corner of each panel. Planets are sorted from top to bottom in the order of detection from an iterative TLS search of the K2 light curve. Planet “h” (bottom panels) is a false positive and not related to the actual detection of TRAPPIST-1 h (see Sect. 3.3). Middle panels: entire K2 light curve of TRAPPIST-1 with the detected in-transit data points highlighted in red. Transits detected in previous iterations were masked. Right panels: SDE(P) diagram for the light curve shown in the center.
Current usage metrics show cumulative count of Article Views (full-text article views including HTML views, PDF and ePub downloads, according to the available data) and Abstracts Views on Vision4Press platform.
Data correspond to usage on the plateform after 2015. The current usage metrics is available 48-96 hours after online publication and is updated daily on week days.
Initial download of the metrics may take a while.