Fig. 6.
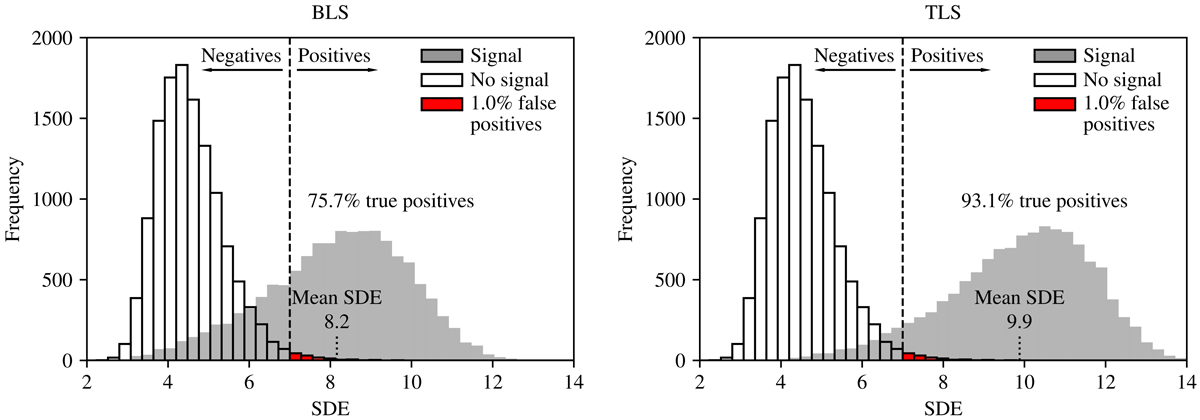
Statistics of the signal detection efficiency for a transit injection-retrieval experiment of simulated light curves with white noise only. Left panel: box least squares algorithm. Right panel: transit least squares algorithm. Both panels show the results of 10 000 realizations of a 3 yr light curve with white noise only (open histograms) and of the same amount of light curves with white noise and an Earth-like planetary transit around a G2V star (gray histograms). Outlined histograms relate to the SDE maximum value in a noise-only search. Gray histograms refer to the highest SDE value within 1% of the period of the injected transit. The SDE thresholds at which the false positive rates are 1% is found to be SDEfp = 1% = 7. At this SDE threshold, the recovery rate of the injected signals (the true positive rate) is 75.7% for BLS and 93.1% for TLS, while the fraction of missed signals (the false negative rate) is 24.3% for BLS and 6.9% for TLS.
Current usage metrics show cumulative count of Article Views (full-text article views including HTML views, PDF and ePub downloads, according to the available data) and Abstracts Views on Vision4Press platform.
Data correspond to usage on the plateform after 2015. The current usage metrics is available 48-96 hours after online publication and is updated daily on week days.
Initial download of the metrics may take a while.