Fig. 3.
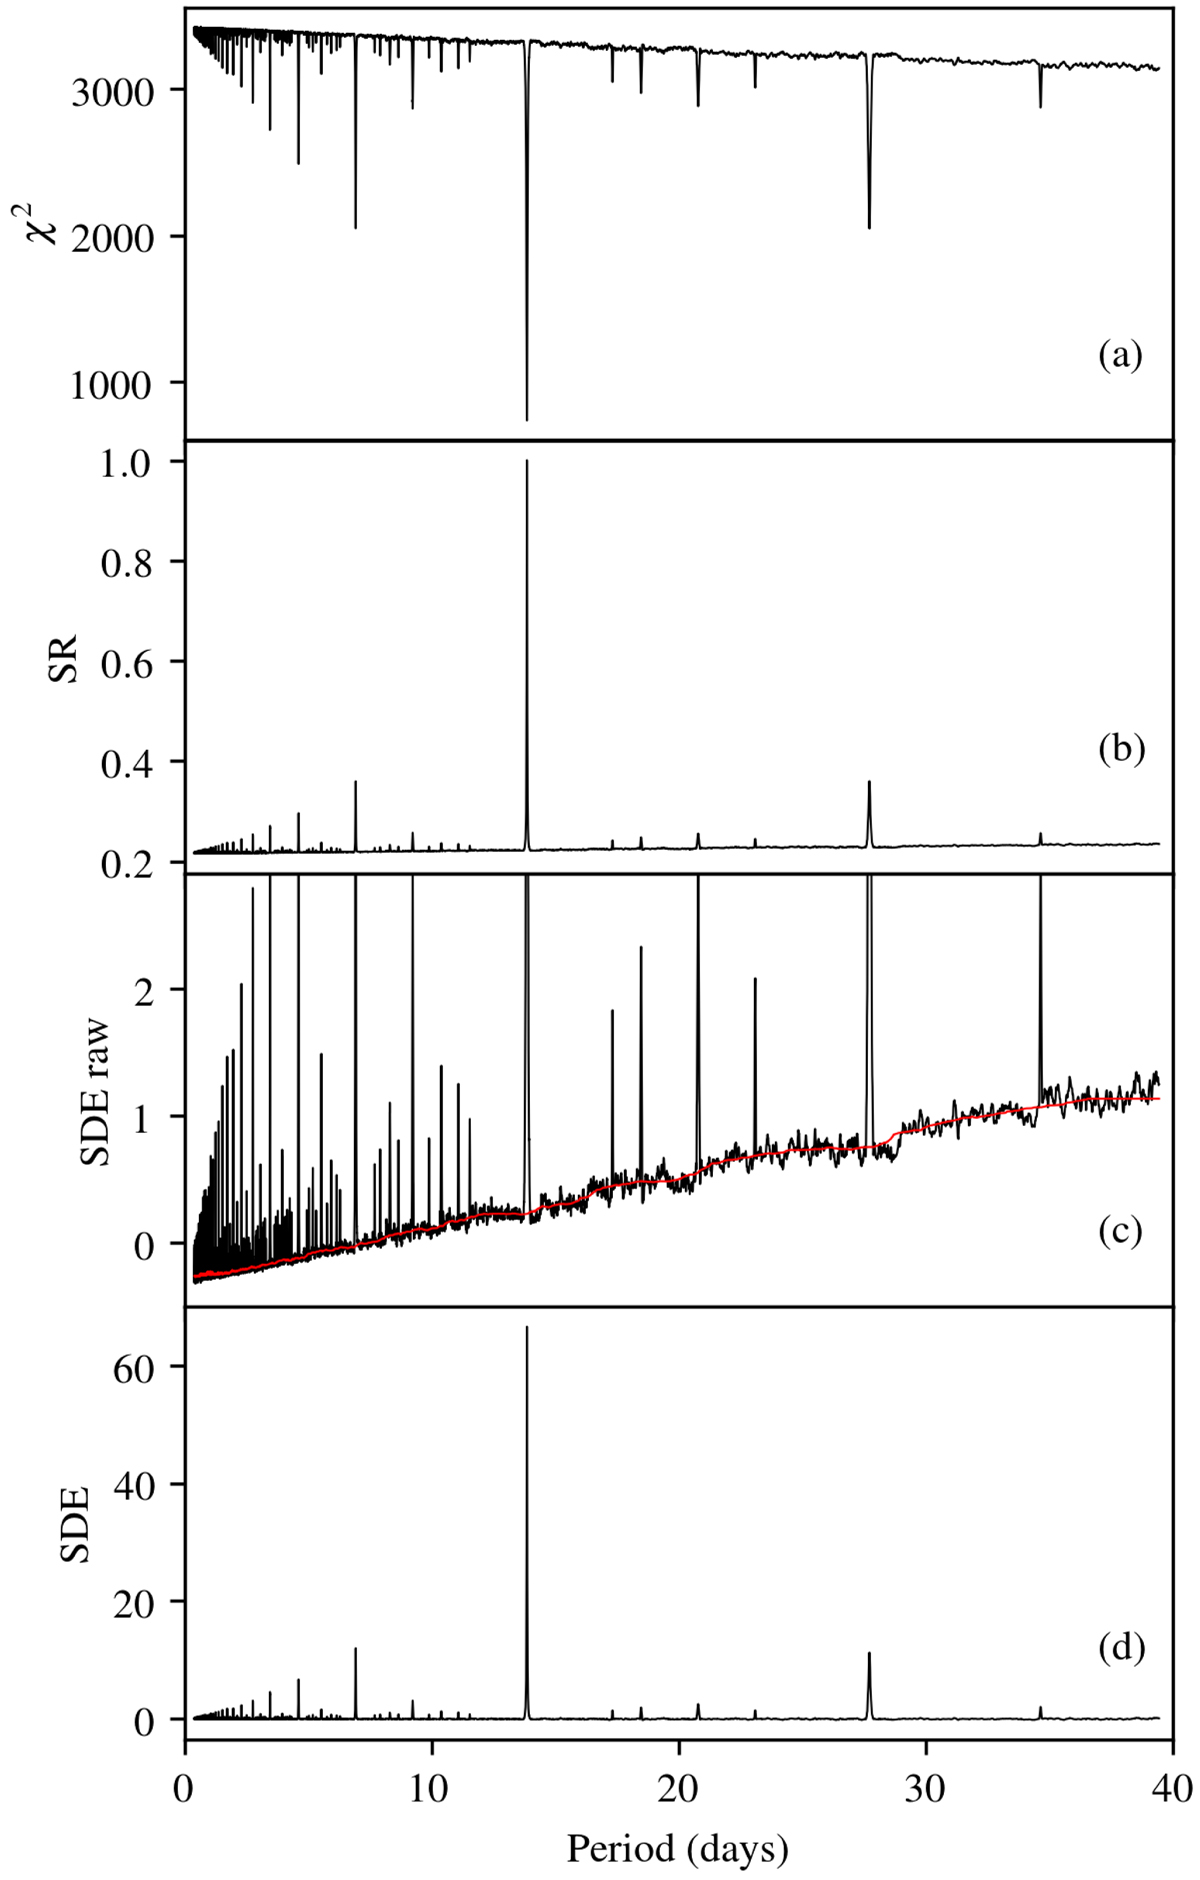
Panel a: distribution of χ2 (minimized over t0, d) obtained by phase-folding the light curve of K2-110 b over different trial periods. Panel b: signal residue for the best fitting periods throughout the parameter space. Panel c: raw signal detection efficiency (black line) and walking median (red line). Panel d: signal detection efficiency used by TLS. This is the result of the division of the raw SDE by its walking mean in panel c.
Current usage metrics show cumulative count of Article Views (full-text article views including HTML views, PDF and ePub downloads, according to the available data) and Abstracts Views on Vision4Press platform.
Data correspond to usage on the plateform after 2015. The current usage metrics is available 48-96 hours after online publication and is updated daily on week days.
Initial download of the metrics may take a while.