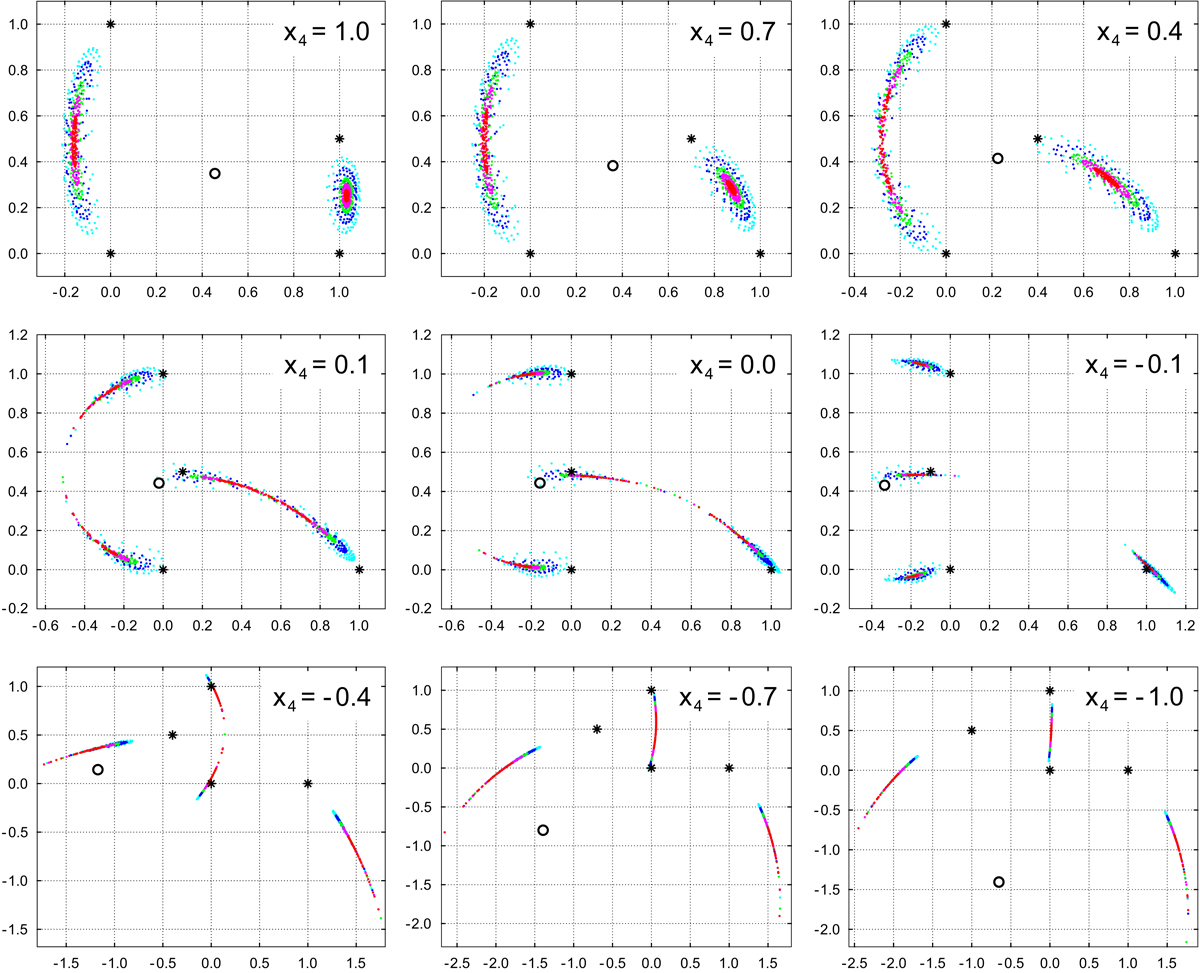
Fig. 5.

Calculated projections of the energy-release region (taken at the top of the separator) along the magnetic field lines onto the horizontal plane (located at the height h = 0.3 above the plane of magnetic sources) at various positions of the fourth source x4. The red, magenta, green, blue, and cyan points correspond to the various radii of the energy-release region R = 0.05, 0.10, 0.15, 0.25, and 0.35, respectively. Positions of the magnetic field sources are denoted by the asterisks, and vertical projections of the energy-release regions are shown by the small circles.
Current usage metrics show cumulative count of Article Views (full-text article views including HTML views, PDF and ePub downloads, according to the available data) and Abstracts Views on Vision4Press platform.
Data correspond to usage on the plateform after 2015. The current usage metrics is available 48-96 hours after online publication and is updated daily on week days.
Initial download of the metrics may take a while.


