Fig. 3.
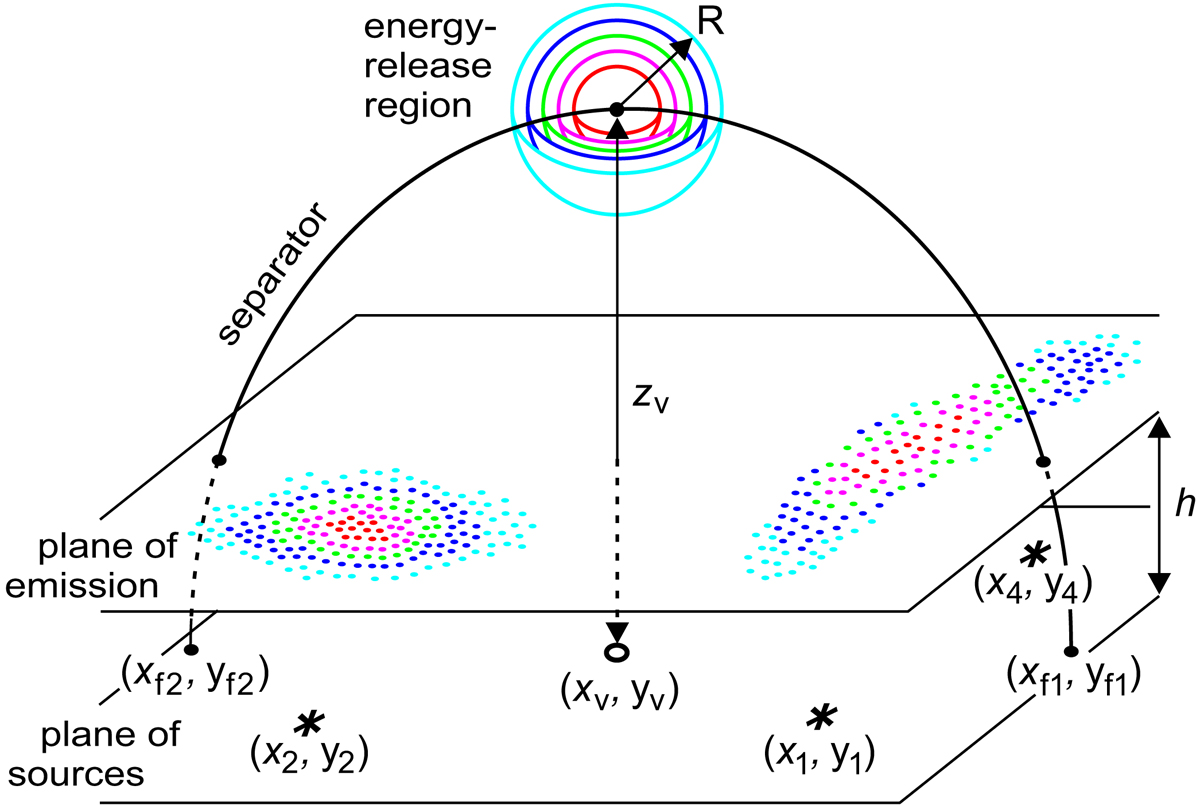
Sketch of projections of the energy-release regions with various radii R (indicated by red, magenta, green, blue, and cyan) along the magnetic field lines onto the plane located at height h above the field sources. The sources are denoted by asterisks and the vertical projection of the center of the energy-release region is denoted by a small thick circle.
Current usage metrics show cumulative count of Article Views (full-text article views including HTML views, PDF and ePub downloads, according to the available data) and Abstracts Views on Vision4Press platform.
Data correspond to usage on the plateform after 2015. The current usage metrics is available 48-96 hours after online publication and is updated daily on week days.
Initial download of the metrics may take a while.