Free Access
Fig. 8
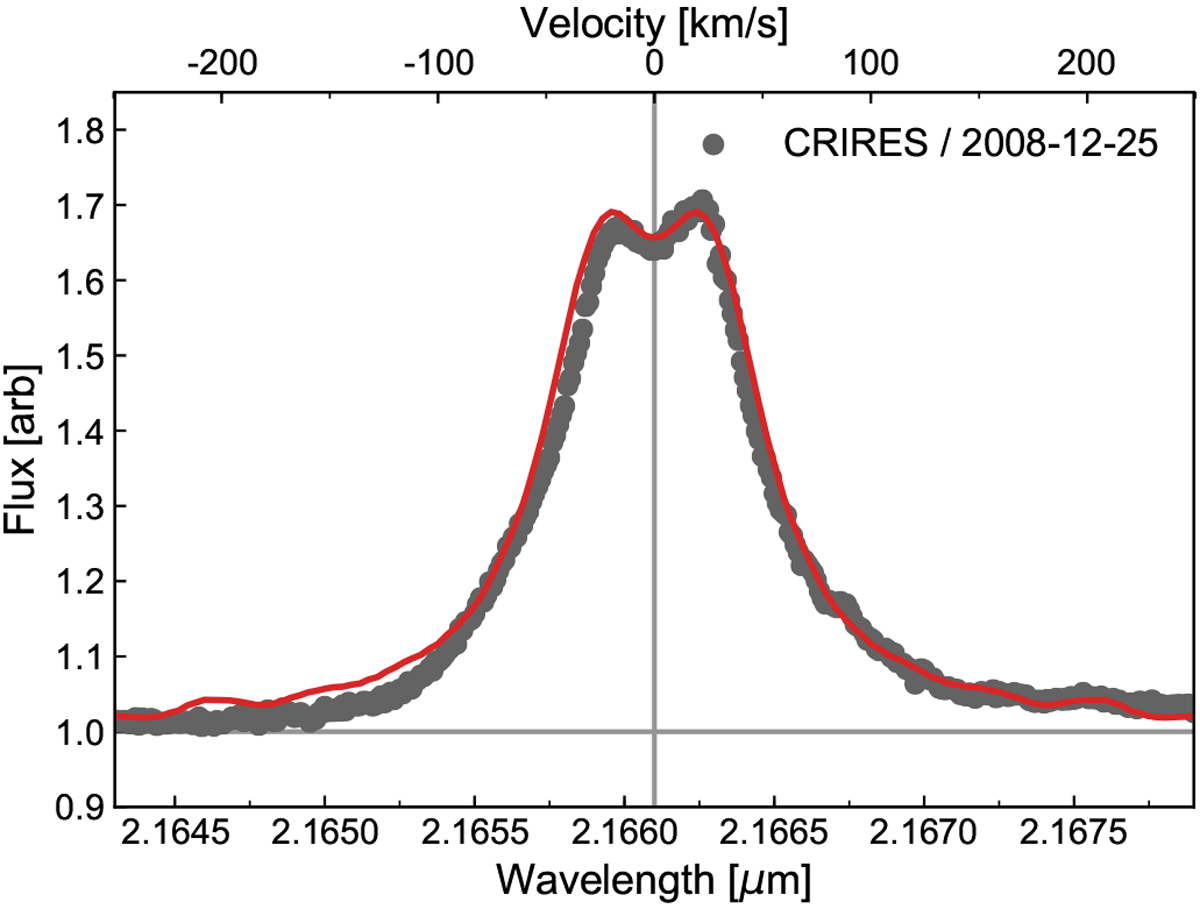
Spectrum calculated from our kinematic model and compared to our observed VLT/CRIRES data. The solid red line represents the model spectrum and the grey points represent the observed CRIRES spectrum.
Current usage metrics show cumulative count of Article Views (full-text article views including HTML views, PDF and ePub downloads, according to the available data) and Abstracts Views on Vision4Press platform.
Data correspond to usage on the plateform after 2015. The current usage metrics is available 48-96 hours after online publication and is updated daily on week days.
Initial download of the metrics may take a while.