Fig. 5
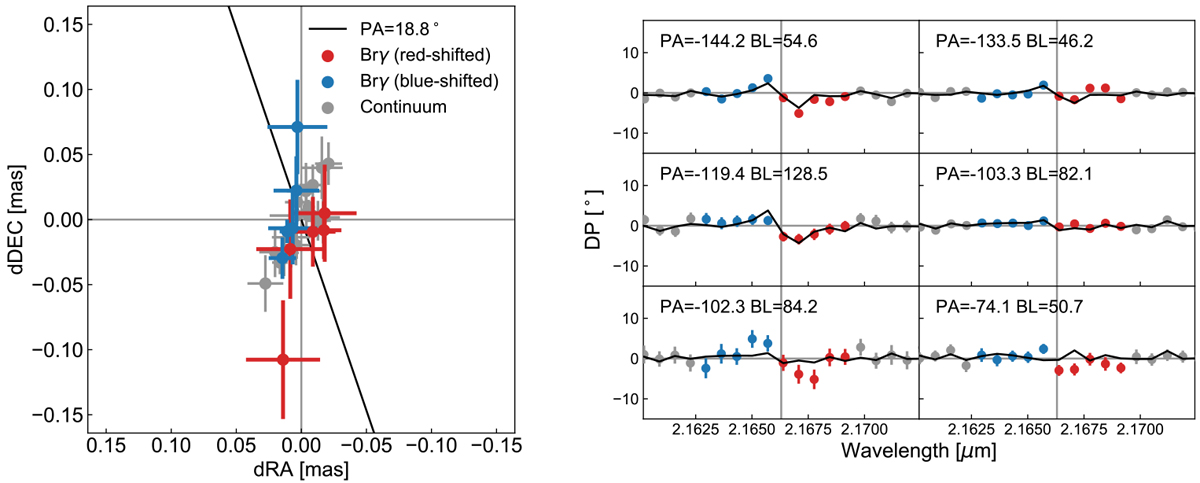
Left panel: derived 2D photocentre displacement vectors for the Brγ line + continuum determined from our AMBER MR-K data. The black line shows an estimated PA for the displacement between blue- and red-shifted vectors. Right panel: differential phase (DP) data for MWC 147 observed with AMBER’s MR-K mode(circular points) compared with differential phases calculated from the photocentre shifts shown in the right panel of this figure (black lines). The baseline label in the upper corner gives the PA in degrees and the baseline (BL) in metres. The line (red and blue) and continuum (grey) points from the left panel correspond to the similar coloured points in the right panel.
Current usage metrics show cumulative count of Article Views (full-text article views including HTML views, PDF and ePub downloads, according to the available data) and Abstracts Views on Vision4Press platform.
Data correspond to usage on the plateform after 2015. The current usage metrics is available 48-96 hours after online publication and is updated daily on week days.
Initial download of the metrics may take a while.