Free Access
Fig. 4
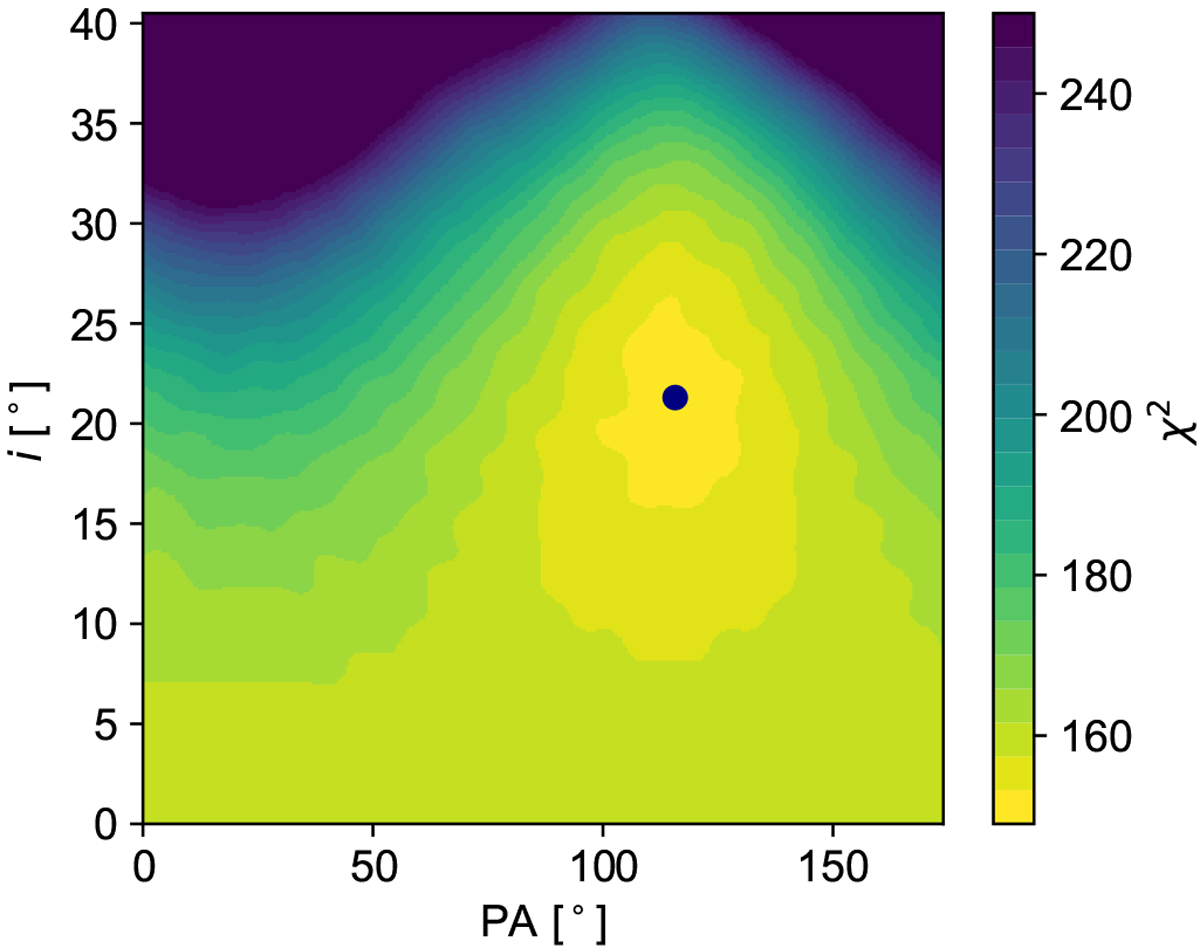
Two-dimensional χ2 map showing the dependence between the best-fit model PA and the inclination of our ring model. The colour scale illustrates the total χ2 for each value of the PA and inclination and the best-fit model values are indicated by the blue data point.
Current usage metrics show cumulative count of Article Views (full-text article views including HTML views, PDF and ePub downloads, according to the available data) and Abstracts Views on Vision4Press platform.
Data correspond to usage on the plateform after 2015. The current usage metrics is available 48-96 hours after online publication and is updated daily on week days.
Initial download of the metrics may take a while.