Free Access
Fig. 2
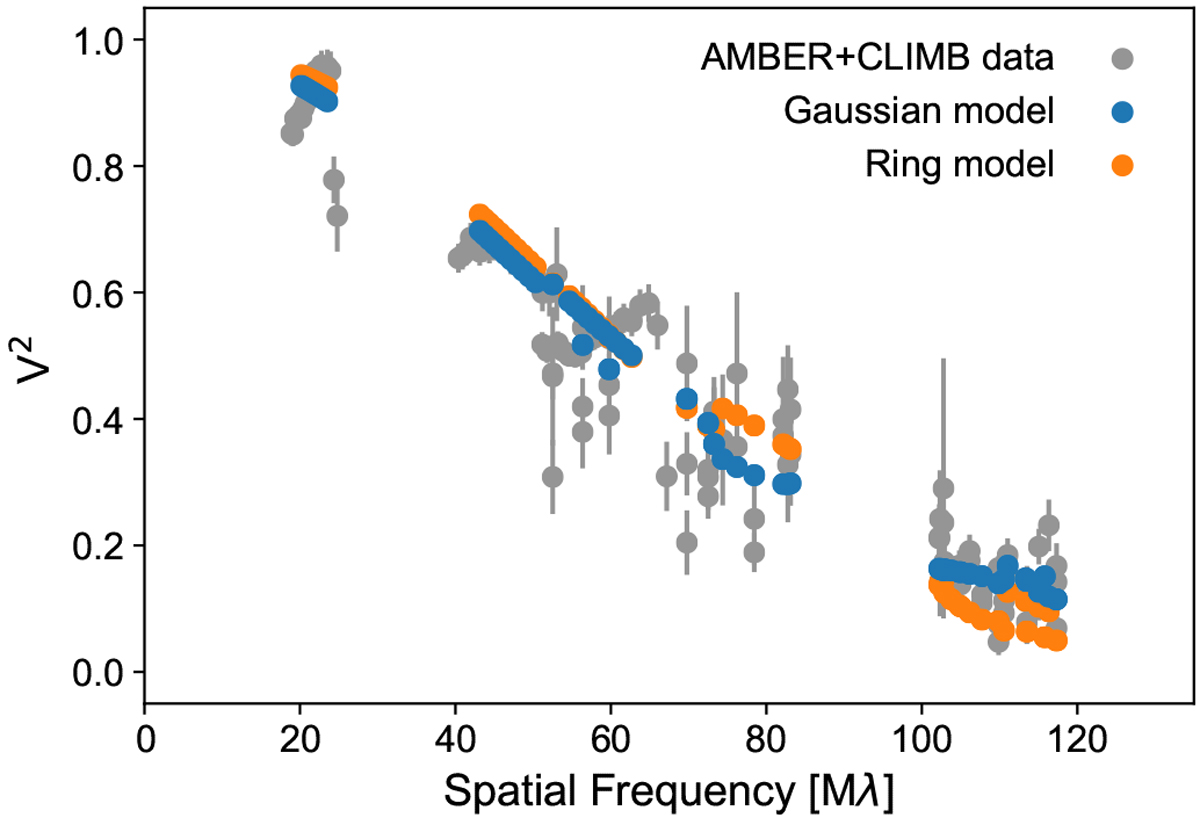
Visibility squared vs. spatial frequency (baseline length) for our VLTI/AMBER and CHARA/CLIMB data for MWC 147. The observed data with uncertainties are shown in grey, whereas the results of our inclined Gaussian and ring models are shown in blue and orange, respectively.
Current usage metrics show cumulative count of Article Views (full-text article views including HTML views, PDF and ePub downloads, according to the available data) and Abstracts Views on Vision4Press platform.
Data correspond to usage on the plateform after 2015. The current usage metrics is available 48-96 hours after online publication and is updated daily on week days.
Initial download of the metrics may take a while.