| Issue |
A&A
Volume 623, March 2019
|
|
|---|---|---|
| Article Number | A162 | |
| Number of page(s) | 7 | |
| Section | Atomic, molecular, and nuclear data | |
| DOI | https://doi.org/10.1051/0004-6361/201834587 | |
| Published online | 26 March 2019 | |
Rotational spectroscopy of malononitrile and its corresponding monoisocyanide isomer, isocyanoacetonitrile⋆
1
Université de Lille, Faculté des Sciences et Technologies, Département Physique, Laboratoire de Physique des Lasers, Atomes et Molécules, UMR CNRS 8523, 59655 Villeneuve-d’Ascq Cedex, France
e-mail: This email address is being protected from spambots. You need JavaScript enabled to view it.
2
Institute of Radio Astronomy of the National Academy of Sciences of Ukraine (IRA NASU), 4, Mystetstv St., Kharkiv 61002, Ukraine
3
Quantum Radiophysics Department of V.N. Karazin Kharkiv National University, Svobody Square 4 Kharkiv 61002, Ukraine
4
Univ. Rennes, Ecole Nationale Supérieure de Chimie de Rennes, CNRS, ISCR – UMR6226, 35000 Rennes, France
Received:
6
November
2018
Accepted:
8
January
2019
Abstract
Context. Nitriles constitute almost 20% of the molecules observed in the interstellar medium, whereas only one dinitrile and one isocyanonitrile compound have been detected up to now. The lack of detections of such compounds may be partially explained by the lack of accurate spectroscopic data on their rotational spectra.
Aims. Two small seven-atom dinitriles, malononitrile NCCH2CN and isocyanoacetonitrile NCCH2NC, were chosen as target species for this study. For malononitrile the goal of the study is to systematize all the previous measurements, and to extend the measurements to the sub-millimeter wavelength range. The spectrum of isocyanoacetonitrile has not been studied before.
Methods. The rotational spectra of the two molecules were measured in the frequency range 150–660 GHz using the Lille fast-scan spectrometer. The spectroscopic study was supported by high-level theoretical calculations on the structure of these molecules and their harmonic force field.
Results. Accurate frequency predictions for malononitrile and isocyanoacetonitrile were calculated on the basis of the analysis of their rotational spectra. The influence of the spin statistics on the intensities of the lines of malononitrile was taken into account. The provided line lists and sets of molecular parameters meet the needs of astrophysical searches for the two molecules.
Key words: astrochemistry / ISM: molecules / submillimeter: ISM / line: identification / astronomical databases: miscellaneous
Full Tables A.1–A.3 are only available at the CDS via anonymous ftp to cdsarc.u-strasbg.fr (130.79.128.5) or via http://cdsarc.u-strasbg.fr/viz-bin/qcat?J/A+A/623/A162
© R. A. Motiyenko et al. 2019
 Open Access article, published by EDP Sciences, under the terms of the Creative Commons Attribution License (http://creativecommons.org/licenses/by/4.0), which permits unrestricted use, distribution, and reproduction in any medium, provided the original work is properly cited.
1. Introduction
Only one dicarbonitrile, the protonated cyanogen NCCNH+ (Agúndez et al. 2015), and one isocyano nitrile, isocyanogen, NCNC (Agúndez et al. 2018), have been detected in the interstellar medium (ISM) among about 200 other compounds. The detection of only one dinitrile derivative compared to the numerous nitriles already detected in the ISM is surprising since they constitute nearly 20% of the molecules observed. To give some significant examples, the cyano radical CN was detected as early as 1940 (McKellar 1940), and many cyanopolyynes were found1, as well as the first branched molecule, isopropylcyanide, (Belloche et al. 2014), and, if we exclude fullerenes, benzonitrile, the largest molecule detected in this medium (McGuire et al. 2018).
Several explanations for this can be given, such as the absence of a permanent dipolar moment for the dicyanopolyynes or the lack of millimeter-wave spectra recorded for others. Several dinitrogen compounds are however present in the ISM, such as cyanamide (Turner et al. 1975), aminoacetonitrile (Belloche et al. 2008), and E-cyanomethanimine (Zaleski et al. 2013). Compounds such as the cyanomethyl radical CH2CN, the cyanomethylene radical HC2N, the methylene amidogen H2CN, the cyanomethylidyne radical C2N, the CN radical, and the CN anion are present in this medium. These are potentially highly reactive compounds and probably precursors of many nitriles. In search for simple dinitriles as candidates for the ISM, we selected malononitrile NCCH2CN and isocyanoacetonitrile NCCH2NC as two very simple compounds containing a methylene group and two cyanides or one cyanide and one isocyanide groups, respectively. This study follows the recording of the millimeter-wave spectrum of methylene bis-isocyanide (Motiyenko et al. 2012) which anticipated, along with some others (Haykal et al. 2013; Samdal et al. 2013, 2014; Margulès et al. 2018), the possible presence of other isocyanides in the ISM in addition to the detected methyl and ethynyl isocyanides (Cernicharo et al. 1988; Kawaguchi et al. 1992) and isocyanogen (Agúndez et al. 2018). In the case of compounds with a C3H2N2 formula, the reaction of the cyanomethyl radical with the cyano radical could produce both target compounds, which could also be the products of the reaction of the HC2N radical with hydrogen cyanide or hydrogen isocyanide, or produced by many other routes.
Malononitrile has previously been studied in the centimeter-wave range using Stark modulation spectrometers (Hirota & Morino 1960; Cook et al. 1974), and lately using a high-resolution Fourier-transform spectrometer (Cox et al. 1985) that allowed the analysis of nuclear quadrupole hyperfine structure arising from two equivalent 14N nuclei. Previous measurements of malononitrile in the millimeter-wave range include 64 transitions between 60 and 240 GHz with J ≤ 50 (Burie et al. 1982), and the accurate analysis was performed using the rotational Hamiltonian up to the sixth order. Up to now, malononitrile was not detected in the ISM. Its column density upper limit in TMC-1 was first estimated to be 5 × 1012 cm−2 (Matthews & Sears 1986), and was more recently estimated to be 7 × 1010 cm−2 (Cordiner et al. 2017).
Regarding malononitrile, the present study has two main goals. First, owing to molecular size, and b-type rotational spectrum, the extension of the measurements into the submillimeter-wave range is needed for accurate spectral modeling. In addition, new and more accurate measurements compared to the study by Burie et al. (1982) may be performed using the broadband and fast-scan spectrometer in Lille. Second, systematization of all previous spectroscopic studies and new measurements is needed. Indeed, in previous studies different rotational Hamiltonians were employed for the analysis of the rotational spectrum of malononitrile. In the paper by Cook et al. (1974), the measured transition frequencies were fitted using Watson’s Hamiltonian. In the paper by Burie et al. (1982), the analysis was performed using the rotation-distortion Hamiltonian in the Van Eijck-Typke notation. Finally, the quadrupole interaction Hamiltonian for two nuclei was employed in the paper by Cox et al. (1985) in addition to pure rotational terms. At present, all the previous measurements including those with resolved hyperfine structure may be analyzed using a widely known set of programs SPFIT/SPCAT (Pickett 1991). Another advantage of these programs is the output format of the files, which is adopted in JPL and CDMS databases commonly used by the astrophysics community.
Regarding isocyanoacetonitrile, as no spectroscopic information existed before this study, our goal was to provide the first spectroscopic characterization of this molecule to enable further searches for it in the ISM.
2. Experimental setup
The sample of malononitrile 99% was purchased from Sigma-Aldrich and used without further purification. The sample of isocyanoacetonitrile was synthesized as reported by Buschmann et al. (2000) and kept at liquid-nitrogen (−196 °C) or dry ice temperature (−78.5 °C).
The spectra of both molecules were recorded in the range from 150 to 660 GHz using the Lille spectrometer described by Zakharenko et al. (2015), equipped with a fast-scan mode. The fast-scan design is able to provide a rapid frequency scan with up to 50 μs/point-of-frequency switching rate. It employs an AD9915 direct digital synthesizer (DDS) up-converted into Ku band. The up-conversion is achieved by mixing the DDS output signal in the frequency range 320–420 MHz, and the signal from an Agilent E8257 synthesizer (up to 20 GHz) with subsequent filtering of the upper sideband in a YIG bandpass filter. Thus, the fast frequency scan is provided by sweeping the DDS within the filter bandwidth of 25–40 MHz. The up-converted signal is then multiplied by factor of six into W band (75–110 GHz) using an active multiplier AMC-10 from VDI (Virginia Diodes, Inc). The output power of AMC-10 is enough to drive passive Schottky multipliers from VDI on the next stage of frequency multiplication: ×2 (150–220 GHz), ×3 (225–330 GHz), ×5 (400–500 GHz), and ×6 (500–660 GHz) which consists of adding another multiplication cascade ×3 after the first ×2. Thus, considering the overall multiplication factor from 12 to 36, and the YIG filter bandwidth of 25–40 MHz, the bandwidth for a single fast frequency scan may vary from 300 MHz up to 1400 MHz.
In the present study, in the range 150–220 GHz, the frequency step is 0.036 MHz, and a single scan consisting of 2000 frequency points therefore corresponds to the bandwidth of 72 MHz. With a frequency switching rate of 1 ms/point, and taking the time of the data transfer into account, the scan of 72 MHz was taken in about 2.5 s. Thus, the spectrum of 1 GHz bandwidth was acquired in 35 s, and the full range spectrum of the frequency multiplier ×2 150–220 GHz was acquired in about 2.7 h. The choice of the frequency step is based on the requirement to measure at least ten spectral points within the spectral line full width at half maximum. Such a requirement is important for obtaining accurate line frequencies by least-squares fitting of the line profile. Since in the experimental conditions of the present study, the main line broadening mechanism is the Doppler effect, the frequency step gradually increases with the source frequency. For example, in the range of the frequency multiplier ×6 (500–660 GHz) the frequency step was chosen to be 0.09 MHz. Consequently, a single frequency scan in this range corresponds to the bandwidth of 180 MHz.
The measurements of the rotational spectrum of malononitrile were performed in static mode, in which the absorption cell was filled with the sample once every 4 hours at a typical pressure of about 10 μbars. Owing to relatively low kinetic stability, the measurements of the rotational spectrum of isocyanoacetonitrile were performed in the so-called “flow mode”, that is, the sample of isocyanoacetonitrile was evaporated outside the cell and injected into it through a side opening at one end of the cell and continuously pumped out through another side opening at the other end. The best signal-to-noise ratio (S/N) was achieved when the sample was evaporated at a temperature of −45 °C providing the vapor pressure in the absorption cell of about 10 μbar. At lower temperatures the S/N was reduced owing to lower vapor pressure, and higher temperatures favored faster decomposition of the sample. For both measurements, estimated frequency determination errors are 30, 50, and 100 kHz depending on the observed S/N and frequency range. The examples of the rotational spectra of malononitrile and isocyanoacetonitrile are shown on Fig. 1. We note a significant difference between the S/Ns obtained in the experiments with a stable sample of malononitrile and those obtained with relatively unstable isocyanoacetonitrile.
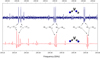 |
Fig. 1. Portions of the millimeter-wave rotational spectra of isocyanoacetonitrile (upper scale, dark blue), and malononitrile (lower scale, red). The lines of malononitrile illustrate the effect of symmetry and nuclear spin statistics as their intensities are related as 7-to-5 depending on the Ka + Kc values, whereas the intensities of the lines of isocyanoacetonitrile are not subjected to spin statistics owing to reduced symmetry. |
3. Quantum chemical calculations
In the present study, the quantum chemical calculations were performed using the Gaussian 09 suite of programs (Frisch et al. 2009).
To provide an initial basis for spectral assignments of isocyanoacetonitrile, the spectroscopic work was supported by quantum chemical calculations. The structural optimization was performed using Møller-Plesset second-order perturbation calculations (MP2; Møller & Plesset 1934), and Peterson and Dunning’s (Peterson & Dunning 2002) correlation-consistent quadruple-ζ wave function augmented with diffuse function aug-cc-pVTZ. The quartic centrifugal distortion constants that may be very important for initial analysis of high-J transitions were obtained by harmonic force-field calculations. Owing to the complexity of the problem the harmonic force-field calculations were performed using density functional theory (DFT) employing Becke’s three-parameter hybrid functional (Becke 1988) and the Lee, Yang, and Parr correlation functional (B3LYP; Lee et al. 1988). The 6-311++G(3df, 2pd) wave function augmented with diffuse functions was employed in the B3LYP calculations. The calculated rotational and quartic centrifugal distortion parameters of isocyanoacetonitrile are given in Table 1 where they may be compared with corresponding experimental values.
Rotational constants of malononitrile and isocyanoacetonitrile.
The estimation of nuclear quadrupole coupling tensor strongly depends on the method used. Bailey (2000) showed a very efficient and low-computational-cost method that provides accurate nuclear quadrupole coupling constants. It consists in low-level field gradient calculations based on the geometry from high-level calculations. The method gives very good results over a variety of molecules including those containing nitrogen nuclei. For 14N, the recommended calculation should be performed using a combination of Becke’s three-parameter and Perdew and Wang (PW91) functionals (Perdew 1992), and using a 6-311+G(df,pd) basis set. To test the accuracy of the method, we first calculated the nuclear quadrupole coupling tensor for malononitrile, and compared its values with corresponding experimental parameters. The calculation was performed using the B3PW91 method and 6-311++G(3df, 2pd) basis set on the MP2/aug-cc-pVQZ optimized structure. The calculated parameters and the experimental ones are given in Table 2. Relatively good agreement between theory and experiment in the case of malononitrile suggests that the same level of accuracy may be achieved in the calculation of the nuclear quadrupole coupling tensor of isocyanoacetonitrile. The χgg values of nitrile and isonitrile 14N atoms of isocyanoacetonitrile calculated using the method of Bailey are given in the last two columns of Table 2.
Diagonal elements (in MHz) of the nuclear quadrupole coupling tensor for malononitrile and isocyanoacetonitrile.
4. Assignment and analysis
Malononitrile and isocyanoacetonitrile are asymmetric top molecules not too far from a symmetric top limit (Ray’s asymmetry parameter respectively, κ = −0.964 and κ = −0.962). The equilibrium configuration of malononitrile has two symmetry planes, and thus, it is described by C2v symmetry point group. Isocyanoacetonitrile is characterized by a single symmetry plane in its equilibrium configuration, and therefore the molecule has Cs symmetry. The dipole moment vector of malononitrile coincides with its molecular b axis, and thus it has only one component whose value was experimentally determined: μb = 3.735(17) D (Hirota & Morino 1960). The following values of the dipole moment components of isocyanoacetonitrile were obtained in this study at MP2/aug-cc-pVQZ level of theory: μa = 0.15 D, and μb = 3.86 D.
For malononitrile, at the first stage of the study, all the transitions available in the literature, including those with resolved hyperfine structure were fitted using the SPFIT program. Since malononitrile has two equivalent 14N nuclei with a spin of I = 1, the following coupling scheme was used: I1 + I2 = I and I + J = F. Consequently, on the basis of the initial analysis, the predictions of the rotational spectrum of malononitrile were produced and used for further assignment. Using the predictions, the assignment process was straightforward as the transitions with Ka ≤ 10 were predicted within a few megahertz. Several refinements of the Hamiltonian parameters dataset were needed to accurately fit and predict the transitions with Ka > 10. The final dataset for the ground vibrational state of malononitrile consists of 2195 distinct frequency lines. The maximum values of J and Ka quantum numbers for the transitions used in the fit are respectively 99 and 19.
For isocyanoacetonitrile, as no spectrocopic information existed before this study, the initial predictions were calculated using the rotational and quartic centrifugal distortion constants obtained from quantum chemical calculations. First, we searched for pairs of the strongest bR−1, 1 and bR1, 1 transitions with Ka = 0 and 1. In addition to being the strongest transitions in the spectrum, they connect levels that are less subjected to centrifugal distortion. Therefore one can expect the lowest error of predicted frequency for such transitions. The corresponding spectral lines were found relatively close (within a few tens of megahertz) to the predicted positions. The initial fit of a series of assigned transitions provided the first set of experimental constants for isocyanoacetonitrile that was used for refining spectral predictions. The following assignment was performed in a classical bootstrap manner, where assigned transitions were used to improve the frequency predictions and search for new ones. The final dataset consists of 1128 lines. The maximum values of the J and Ka quantum numbers for the transitions used in the fit are, respectively, 89 and 18. Compared to malononitrile, the reduced number of lines assigned in the rotational spectrum of isocyanoacetonitrile may be explained by the significantly lower S/N of the recorded spectrum owing to much lower stability of isocyanoacetonitrile. The difference in S/Ns of the spectra of the two molecules may be clearly seen on Fig. 1.
For the two molecules, we also assigned the rotational transitions in the first excited vibrational states. Both states correspond to the first quanta of symmetric in-plane bending of two CCN groups in the case of malononitrile (ν6(A1) mode), and CCN and CNC groups in the case of isocyanoacetonitrile (ν9(A′) mode). The experimental value of v6 = 1 state energy for malononitrile is 167 cm−1 (Fujiyama & Shimanouchi 1964). According to quantum chemical calculations, the v9 = 1 state of isocyanoacetonitrile lies 137 cm−1 above the ground state and its Boltzmann factor at room temperature is 0.6. The rotational transitions of the first excited states were assigned in a manner similar to the ground state of isocyanoacetonitrile, starting with vibrational satellites of the bR−1, 1 and bR1, 1 lines with Ka = 0 and 1. The assignment was also facilitated by the use of the centrifugal distortion constants of the ground state as a basis for the initial frequency predictions. In total, we assigned 1900 and 570 distinct frequency lines respectively belonging to the v6 = 1 state of malononitrile, and the v9 = 1 state of isocyanoacetonitrile. We also included the frequencies of 11 previously measured transitions (Hirota 1961) in the final dataset for the v6 = 1 state of malononitrile.
All the datasets of the assigned lines of the ground and first excited vibrational states for the two molecules were fitted using the A-reduction of the Watson’s Hamiltonian in Ir coordinate representation. The results of the fits are given in Table 1. The nuclear quadrupole coupling parameters of malononitrile are given in Table 2. Since the hyperfine splittings were not resolved in this study, the χgg parameters were obtained by refitting the transitions from the paper by Cox et al. (1985). As expected, the obtained values of χaa and χbb − χcc are very close to those obtained previously (within standard deviation) and indicate the correctness of the model applied in this study. Correspondingly, the values of the asymmetry parameter η = (χbb − χcc)/χaa are also close: 0.728 in this study, and 0.731 in the paper by Cox et al. (1985). For both molecules, full sets of Hamiltonian parameters up to the sixth order were obtained. In addition, some of the eighth- and tenth-order parameters (in the case of malononitrile) were also determined.
On the basis of the results of the fits, we calculated spectral predictions of the ground states for both molecules. The predictions calculated at T = 300 K are given in Tables A.1 and A.2. We also calculated the spectrum of malononitrile including the nuclear quadrupole hyperfine structure, and for low values of J quantum number in the range 0 ≤ J ≤ 15, where significant hyperfine splittings may be observed. The spectrum is given in Table A.3. Owing to their significant sizes, the complete versions of Tables A.1–A.3 are presented at CDS. Here only a part of these tables is presented for illustration purposes. The tables include quantum numbers, calculated transition frequency and corresponding uncertainties, base-10 logarithm of the integrated transition intensity in the units of JPL and CDMS catalogs, nm2 MHz, and lower state energy in cm−1.
The calculations of the line intensities for malononitrile requires taking two important aspects into account. First, owing to symmetry properties, the intensities of rotational transitions of malononitrile are subjected to spin statistics. For the ground vibrational state of malononitrile, the nuclear statistical weights are 15 for the rotational levels with Ka + Kc = even, and 21 for the rotational levels with Ka + Kc = odd. The same intensity features were previously observed for a similar molecule, diisocyanomethane (Motiyenko et al. 2012), and a more detailed explanation about spin weight factors is provided in that paper. The influence of nuclear spin statistics on the intensities of rotational lines is illustrated in Fig. 1, where a series of bQ1, −1 transitions of the ground state of malononitrile are compared to the same transitions of isocyanoacetonitrile. Owing to reduced symmetry, the transition intensities of the latter are not subjected to spin statistics and hence represent doublets with two equivalent components, whereas the intensities of rotational lines of malononitrile have a ratio of approximately 7/5 depending on the sum Ka + Kc.
Second, the rotational partition function for malononitrile should also take the symmetry properties into account for the calculations using the SPCAT program. With a good degree of approximation, the rotational partition function Qr(T) may be expressed as
 (1)
(1)
where A, B, and C are the rotational constants, gn is total nuclear spin weight factor, which is equal to 36 in the case of malononitrile, and σ is a measure of the degree of symmetry. The latter is defined as “the number of indistinguishable positions that can be achieved through simple rotation of the rigid molecule” (Gordy & Cook 1984). Given that equilibrium structure of malononitrile belongs to C2v symmetry point group, and there are two equivalent indistinguishable positions of the molecule that may be obtained via a rotation of π radians about the symmetry axis b, the symmetry number σ = 2. For isocyanoacetonitrile belonging to Cs symmetry point group, the factor  may be ignored, as σ = 1, and gn will cancel from the numerator and denominator in the calculation of the fraction of molecules in a given rotational state (see Eq. (3.63) in Gordy & Cook 1984).
Table 3 provides the values of partition function for the two studied molecules calculated at a range of temperatures. It should be noted that the tabulated Qr(T) values do not take the nuclear quadrupole hyperfine structure into account. To calculate the intensities in Table A.3 the partition function was multiplied by a factor of nine, which represents the spin degeneracy owing to two 14N nuclei. In addition, as a result of symmetry considerations, the intensities of hyperfine components in Table A.3 are also weighted depending on the quantum number I. As was pointed out by Cox et al. (1985), in the presence of hyperfine splittings, the weight factors of 15 and 21 for even and odd states are distributed as 5:9:1 and 15:3:3, respectively, for I = 2, 1, and 0.
Rotational partition functions Qr(T) of malononitrile and isocyanoacetonitrile at various temperatures.
5. Conclusions
Previous attempts to detect malononitrile in the ISM (Matthews & Sears 1986; Cordiner et al. 2017) were performed in centimeter-range which is more adapted for cold regions. However, even at the excitation temperature of 10 K that is typically assumed for TMC-1, the absorption maximum of malononitrile is around 150 GHz. The present comprehensive investigation of the rotational spectrum of malononitrile enables the extension of the searches into millimeter-submillimeter waves that may be more suitable for warmer molecular clouds such as Sgr B2 where many nitriles (Belloche et al. 2013) including branched-molecule iso-propyl cyanide (Belloche et al. 2014) were detected. Owing to b-type spectrum, the absorption maximum of malononitrile at the characteristic temperature of Sgr B2 of 150 K is around 600 GHz. In this study, we obtained accurate frequency predictions of the rotational spectra of malononitrile and isocyanoacetonitrile for the transitions involving levels with J ≤ 99 and Ka ≤ 20 and in the frequency range up to 1 THz.
Acknowledgments
The research leading to these results has received funding from the French Programme National “Physique et Chimie du Milieu Interstellaire”, and from the ANR-13-BS05-0008 IMOLABS of the French Agence Nationale de la Recherche. J.-C. G. also thanks the Centre National d’Etudes Spatiales (CNES) for financial support.
References
- Agúndez, M., Cernicharo, J., de Vicente, P., et al. 2015, A&A, 579, L10 [NASA ADS] [CrossRef] [EDP Sciences] [Google Scholar]
- Agúndez, M., Marcelino, N., & Cernicharo, J. 2018, ApJ, 861, L22 [NASA ADS] [CrossRef] [Google Scholar]
- Bailey, W. C. 2000, Chem. Phys., 252, 57 [CrossRef] [Google Scholar]
- Becke, A. D. 1988, Phys. Rev. A, 38, 3098 [Google Scholar]
- Belloche, A., Menten, K., Comito, C., et al. 2008, A&A, 492, 769 [NASA ADS] [CrossRef] [EDP Sciences] [Google Scholar]
- Belloche, A., Müller, H. S., Menten, K. M., Schilke, P., & Comito, C. 2013, A&A, 559, A47 [NASA ADS] [CrossRef] [EDP Sciences] [Google Scholar]
- Belloche, A., Garrod, R. T., Müller, H. S., & Menten, K. M. 2014, Science, 345, 1584 [NASA ADS] [CrossRef] [PubMed] [Google Scholar]
- Burie, J., Boucher, D., Demaison, J., & Dubrulle, A. 1982, J. Phys., 43, 1319 [CrossRef] [Google Scholar]
- Buschmann, J., Lentz, D., Luger, P., et al. 2000, Z. Anorg. Allgem. Chem., 626, 2107 [CrossRef] [Google Scholar]
- Cernicharo, J., Kahane, C., Guelin, M., & Gomez-Gonzalez, J. 1988, A&A, 189, L1 [Google Scholar]
- Cook, R. L., Walden, R., & Jones, G. E. 1974, J. Mol. Spectr., 53, 370 [NASA ADS] [CrossRef] [Google Scholar]
- Cordiner, M., Charnley, S., Kisiel, Z., McGuire, B., & Kuan, Y.-J. 2017, ApJ, 850, 187 [NASA ADS] [CrossRef] [Google Scholar]
- Cox, A., Kawashima, Y., Fliege, E., & Dreizler, H. 1985, Z. Naturforsch., 40, 361 [NASA ADS] [Google Scholar]
- Frisch, M. J., Trucks, G. W., Schlegel, H. B., et al. 2009, Gaussian 09, revision D.01 (Wallingford, CT: Gaussian, Inc.) [Google Scholar]
- Fujiyama, T., & Shimanouchi, T. 1964, Spectr. Acta, 20, 829 [NASA ADS] [CrossRef] [Google Scholar]
- Gordy, W., & Cook, R. L. 1984, Microwave Molecular Spectra (New York: Wiley) [Google Scholar]
- Haykal, I., Margulès, L., Huet, T. R., et al. 2013, ApJ, 777, 120 [NASA ADS] [CrossRef] [Google Scholar]
- Hirota, E. 1961, J. Mol. Spectr., 7, 242 [NASA ADS] [CrossRef] [Google Scholar]
- Hirota, E., & Morino, Y. 1960, Bull. Chem. Soc. Jpn., 33, 158 [CrossRef] [Google Scholar]
- Kawaguchi, K., Ohishi, M., Ishikawa, S.-I., & Kaifu, N. 1992, ApJ, 386, L51 [NASA ADS] [CrossRef] [Google Scholar]
- Lee, C., Yang, W., & Parr, R. G. 1988, Phys. Rev. B, 37, 785 [Google Scholar]
- Margulès, L., Tercero, B., Guillemin, J., Motiyenko, R., & Cernicharo, J. 2018, A&A, 610, A44 [NASA ADS] [CrossRef] [EDP Sciences] [Google Scholar]
- Matthews, H., & Sears, T. 1986, ApJ, 300, 766 [NASA ADS] [CrossRef] [Google Scholar]
- McGuire, B. A., Burkhardt, A. M., Kalenskii, S., et al. 2018, Science, 359, 202 [Google Scholar]
- McKellar, A. 1940, PASP, 52, 187 [Google Scholar]
- Møller, C., & Plesset, M. S. 1934, Phys. Rev., 46, 618 [NASA ADS] [CrossRef] [Google Scholar]
- Motiyenko, R. A., Margulès, L., & Guillemin, J.-C. 2012, A&A, 544, A82 [NASA ADS] [CrossRef] [EDP Sciences] [Google Scholar]
- Perdew, J. P. 1992, Phys. Rev. B, 45, 13244 [NASA ADS] [CrossRef] [Google Scholar]
- Peterson, K. A., & Dunning, Jr., T. H. 2002, J. Chem. Phys., 117, 10548 [NASA ADS] [CrossRef] [Google Scholar]
- Pickett, H. M. 1991, J. Mol. Spectr., 148, 371 [NASA ADS] [CrossRef] [Google Scholar]
- Samdal, S., Moellendal, H., & Guillemin, J.-C. 2013, J. Phys. Chem. A, 117, 10304 [CrossRef] [Google Scholar]
- Samdal, S., Groenaas, T., Moellendal, H., & Guillemin, J.-C. 2014, J. Phys. Chem. A, 118, 1413 [CrossRef] [Google Scholar]
- Turner, B., Liszt, H., Kaifu, N., & Kisliakov, A. 1975, ApJ, 201, L149 [Google Scholar]
- Zakharenko, O., Motiyenko, R. A., Margulès, L., & Huet, T. 2015, J. Mol. Spectr., 317, 41 [Google Scholar]
- Zaleski, D. P., Seifert, N. A., Steber, A. L., et al. 2013, ApJ, 765, L10 [Google Scholar]
Appendix A: Predictions of the rotational spectra of malononitrile and isocyanoacetonitrile
Predicted transitions of malononitrile in the ground vibrational state.
Predicted transitions of isocyanoacetonitrile in the ground vibrational state.
Predicted transitions of the ground state of malononitrile taking the nuclear quadrupole hyperfine structure into account.
All Tables
Diagonal elements (in MHz) of the nuclear quadrupole coupling tensor for malononitrile and isocyanoacetonitrile.
Rotational partition functions Qr(T) of malononitrile and isocyanoacetonitrile at various temperatures.
Predicted transitions of isocyanoacetonitrile in the ground vibrational state.
Predicted transitions of the ground state of malononitrile taking the nuclear quadrupole hyperfine structure into account.
All Figures
|
Fig. 1. Portions of the millimeter-wave rotational spectra of isocyanoacetonitrile (upper scale, dark blue), and malononitrile (lower scale, red). The lines of malononitrile illustrate the effect of symmetry and nuclear spin statistics as their intensities are related as 7-to-5 depending on the Ka + Kc values, whereas the intensities of the lines of isocyanoacetonitrile are not subjected to spin statistics owing to reduced symmetry. |
| In the text | |
Current usage metrics show cumulative count of Article Views (full-text article views including HTML views, PDF and ePub downloads, according to the available data) and Abstracts Views on Vision4Press platform.
Data correspond to usage on the plateform after 2015. The current usage metrics is available 48-96 hours after online publication and is updated daily on week days.
Initial download of the metrics may take a while.