Fig. B.1.
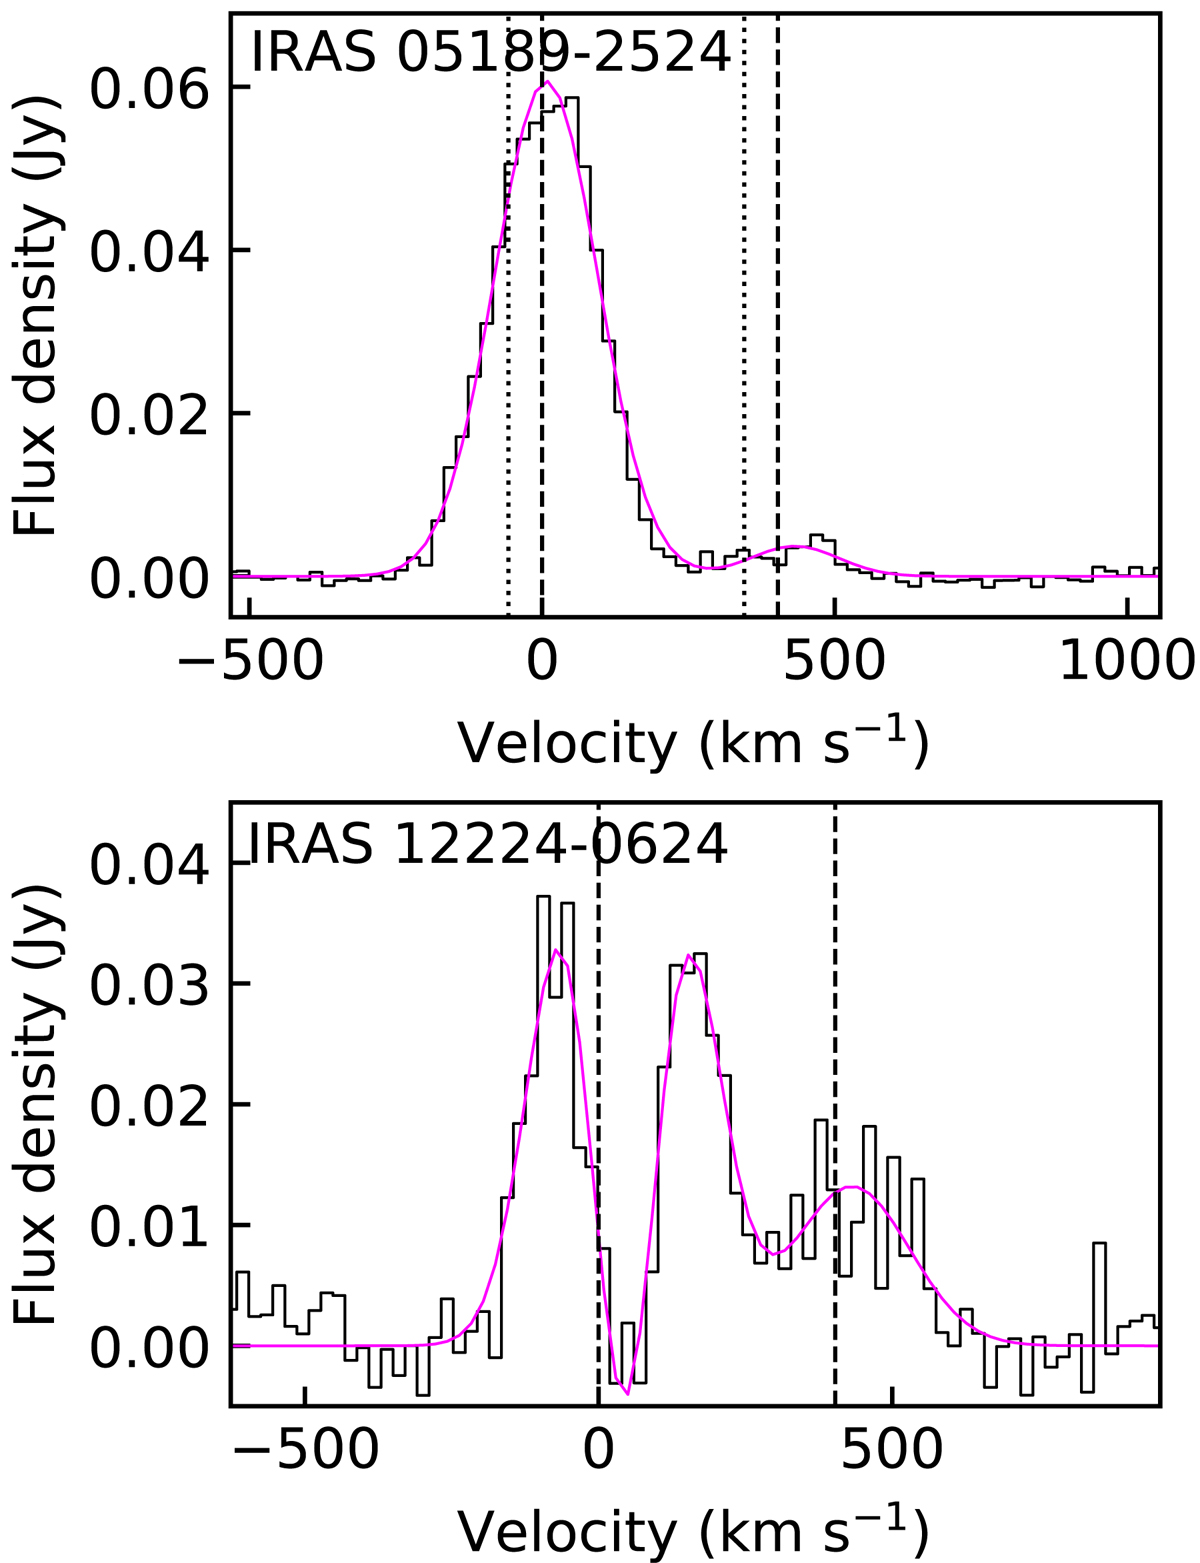
Spectral fits to the HCO+ and HCN-vib J = 4 − 3 lines in the two galaxies IRAS 05189–2524 and IRAS 12224–0624. The solid black histograms represent the data and the solid magenta lines indicate the best fits to the data. The velocity scale is set relative to the frequency of the HCO+J = 4 − 3 line. Dashed vertical lines indicate the expected positions of the HCO+ and HCN-vib J = 4 − 3 lines given the adopted redshifts. The dotted lines in the plot for IRAS 05189–2524 indicate the expected positions given the redshift adopted by Veilleux et al. (2013).
Current usage metrics show cumulative count of Article Views (full-text article views including HTML views, PDF and ePub downloads, according to the available data) and Abstracts Views on Vision4Press platform.
Data correspond to usage on the plateform after 2015. The current usage metrics is available 48-96 hours after online publication and is updated daily on week days.
Initial download of the metrics may take a while.