Fig. 1.
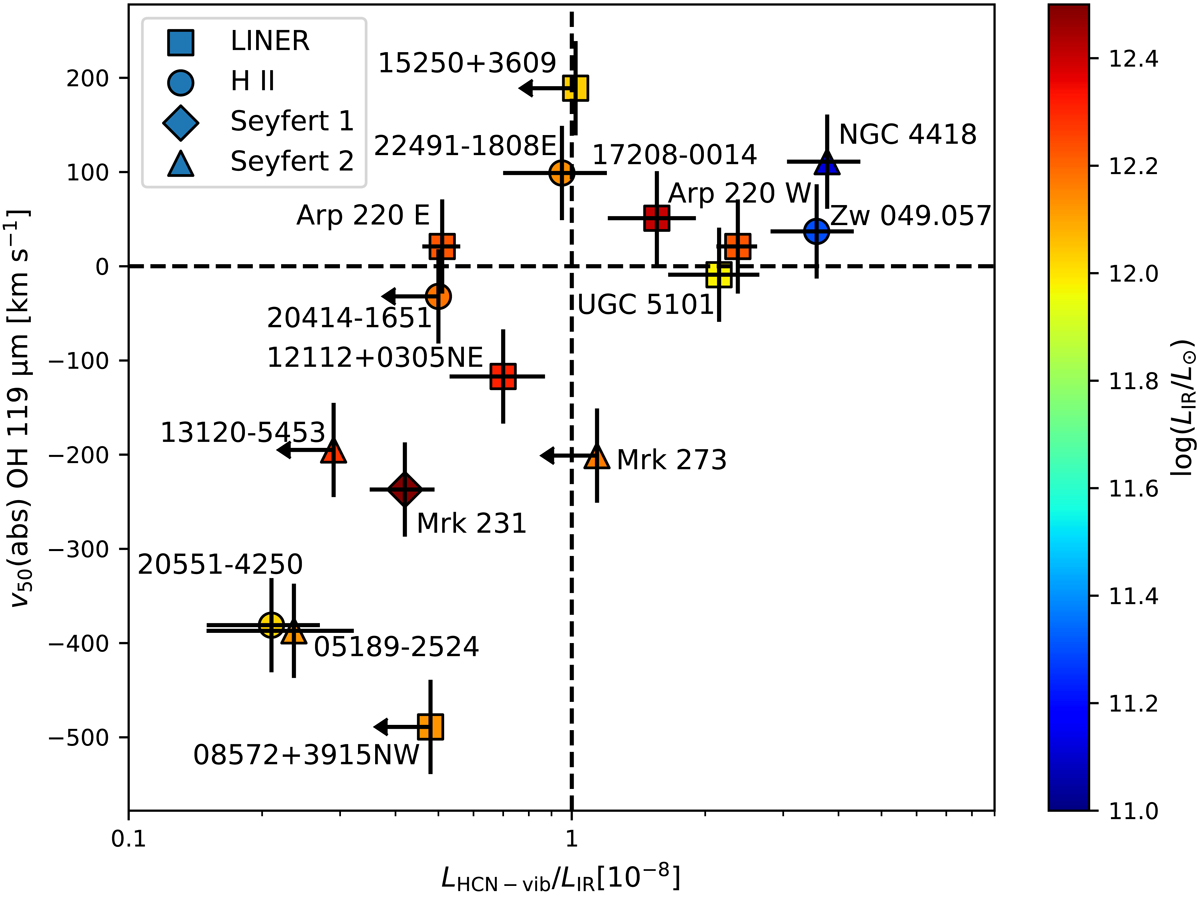
Median OH absorption velocity as a function of the HCN-vib luminosity relative to the total infrared luminosity. For sources with observations of the J = 3 − 2 transition, only this line is plotted. For sources with detections only in the J = 4 − 3 line, the HCN-vib luminosity is scaled down by a factor of 2.5, with an extra uncertainty of 20% included in the error bars. Squares, circles, diamonds, and triangles represent LINER, H II, Seyfert 1, and Seyfert 2 optical spectral types, respectively. Colors indicate the total infrared luminosity of each system. Upper limits (3σ) are indicated with arrows.
Current usage metrics show cumulative count of Article Views (full-text article views including HTML views, PDF and ePub downloads, according to the available data) and Abstracts Views on Vision4Press platform.
Data correspond to usage on the plateform after 2015. The current usage metrics is available 48-96 hours after online publication and is updated daily on week days.
Initial download of the metrics may take a while.