Open Access
Fig. B.1.
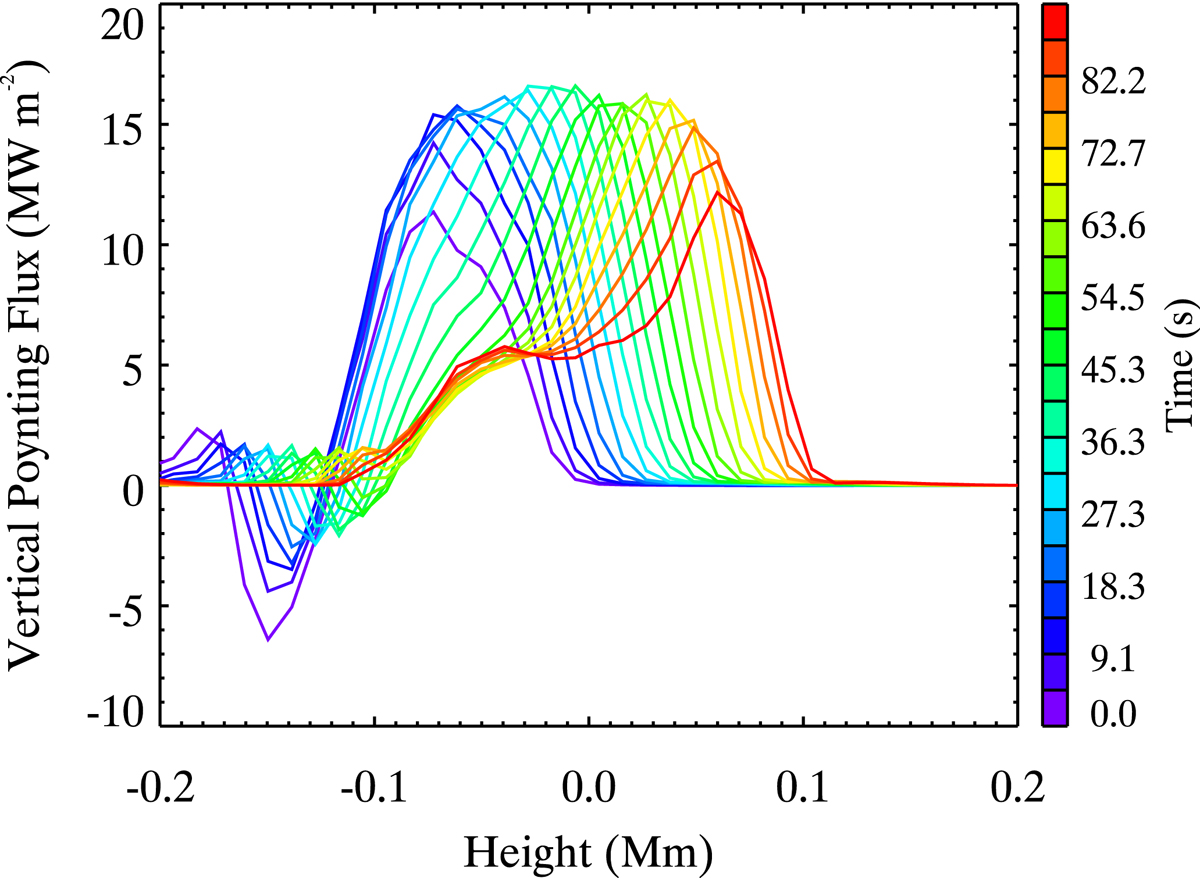
Transfer of Poynting flux through the solar photosphere. Each curve represent the vertical component of the Poynting flux at a given location in a simulated flux emergence event, with in a height range of ±0.2 Mm near the solar surface. The colors denote the temporal evolution of the event. See Sect. 3 for details.
Current usage metrics show cumulative count of Article Views (full-text article views including HTML views, PDF and ePub downloads, according to the available data) and Abstracts Views on Vision4Press platform.
Data correspond to usage on the plateform after 2015. The current usage metrics is available 48-96 hours after online publication and is updated daily on week days.
Initial download of the metrics may take a while.