Fig. 7.
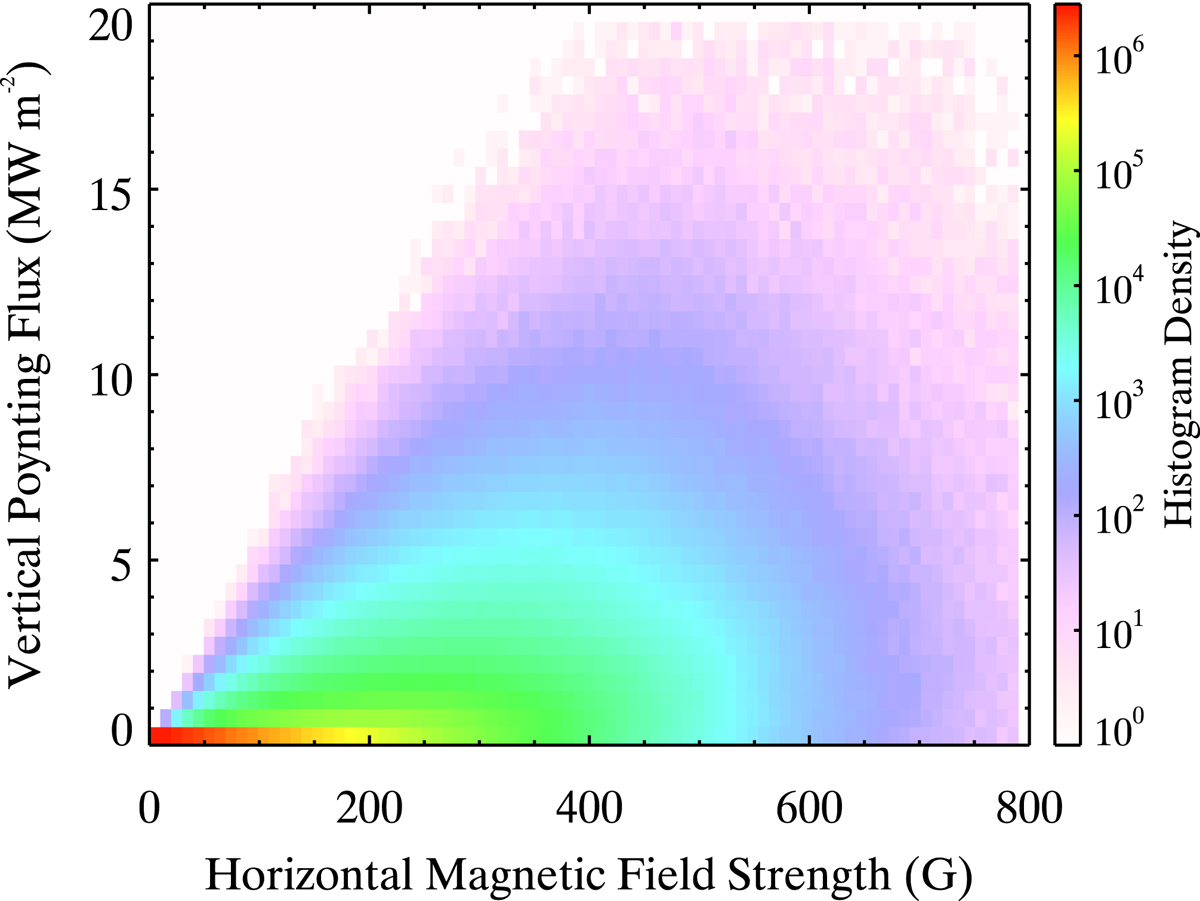
Statistical association of photospheric horizontal magnetic field and the vertical component of the Poynting flux. The histogram displayed in logarithmic scaling is a joint probability density function between horizontal magnetic field strength and the vertical component of the Poynting flux at the photosphere, sampled for a period of 15 min. The two quantities roughly correspond to the average τ500 = 1 surface. See Sect. 3 for details.
Current usage metrics show cumulative count of Article Views (full-text article views including HTML views, PDF and ePub downloads, according to the available data) and Abstracts Views on Vision4Press platform.
Data correspond to usage on the plateform after 2015. The current usage metrics is available 48-96 hours after online publication and is updated daily on week days.
Initial download of the metrics may take a while.