Fig. B.2.
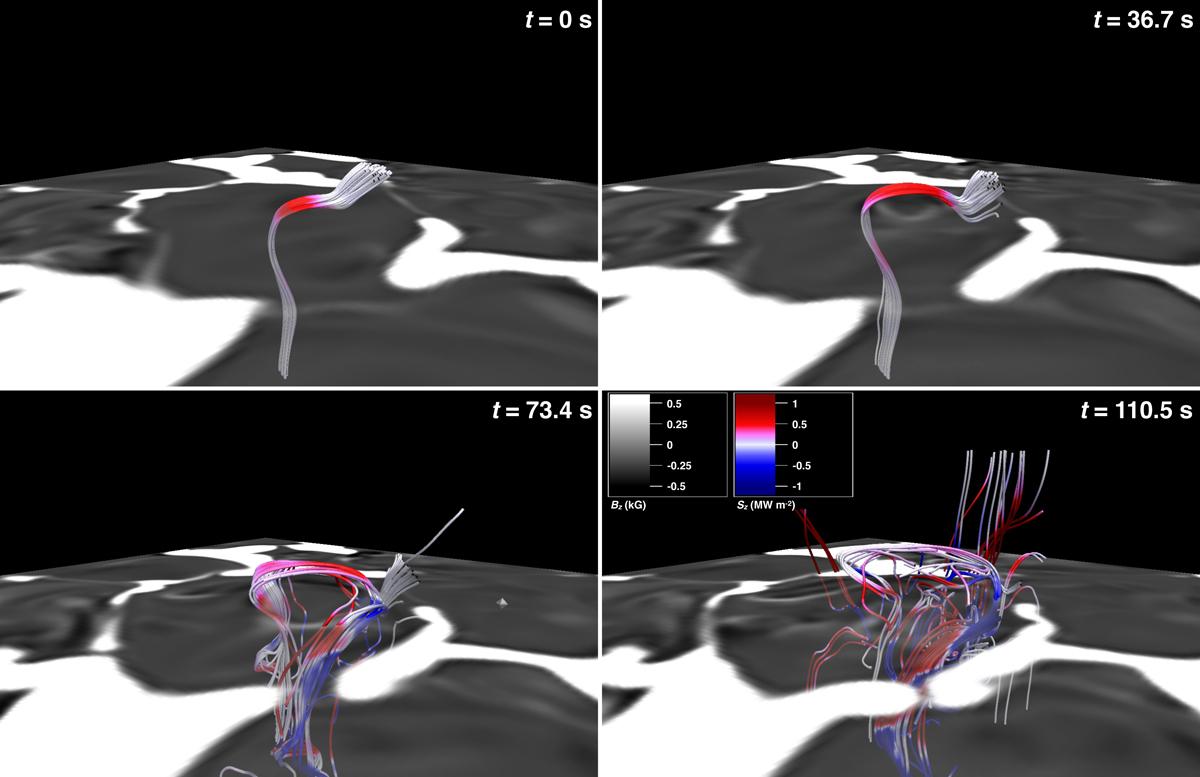
Visualisation of a simulated magnetic flux transient. Displayed here are four instances of a small flux emergence event within a granule. The surface covers an area of 3 Mm × 3 Mm. Each snapshot is about 37 s apart. The grayscale image shows the vertical component of the magnetic field near the photosphere. The solid curves trace the magnetic field in the 3D domain. Each field line is color coded with the vertical component of the Poynting flux. See Sect. 3 for details.
Current usage metrics show cumulative count of Article Views (full-text article views including HTML views, PDF and ePub downloads, according to the available data) and Abstracts Views on Vision4Press platform.
Data correspond to usage on the plateform after 2015. The current usage metrics is available 48-96 hours after online publication and is updated daily on week days.
Initial download of the metrics may take a while.