Fig. 11
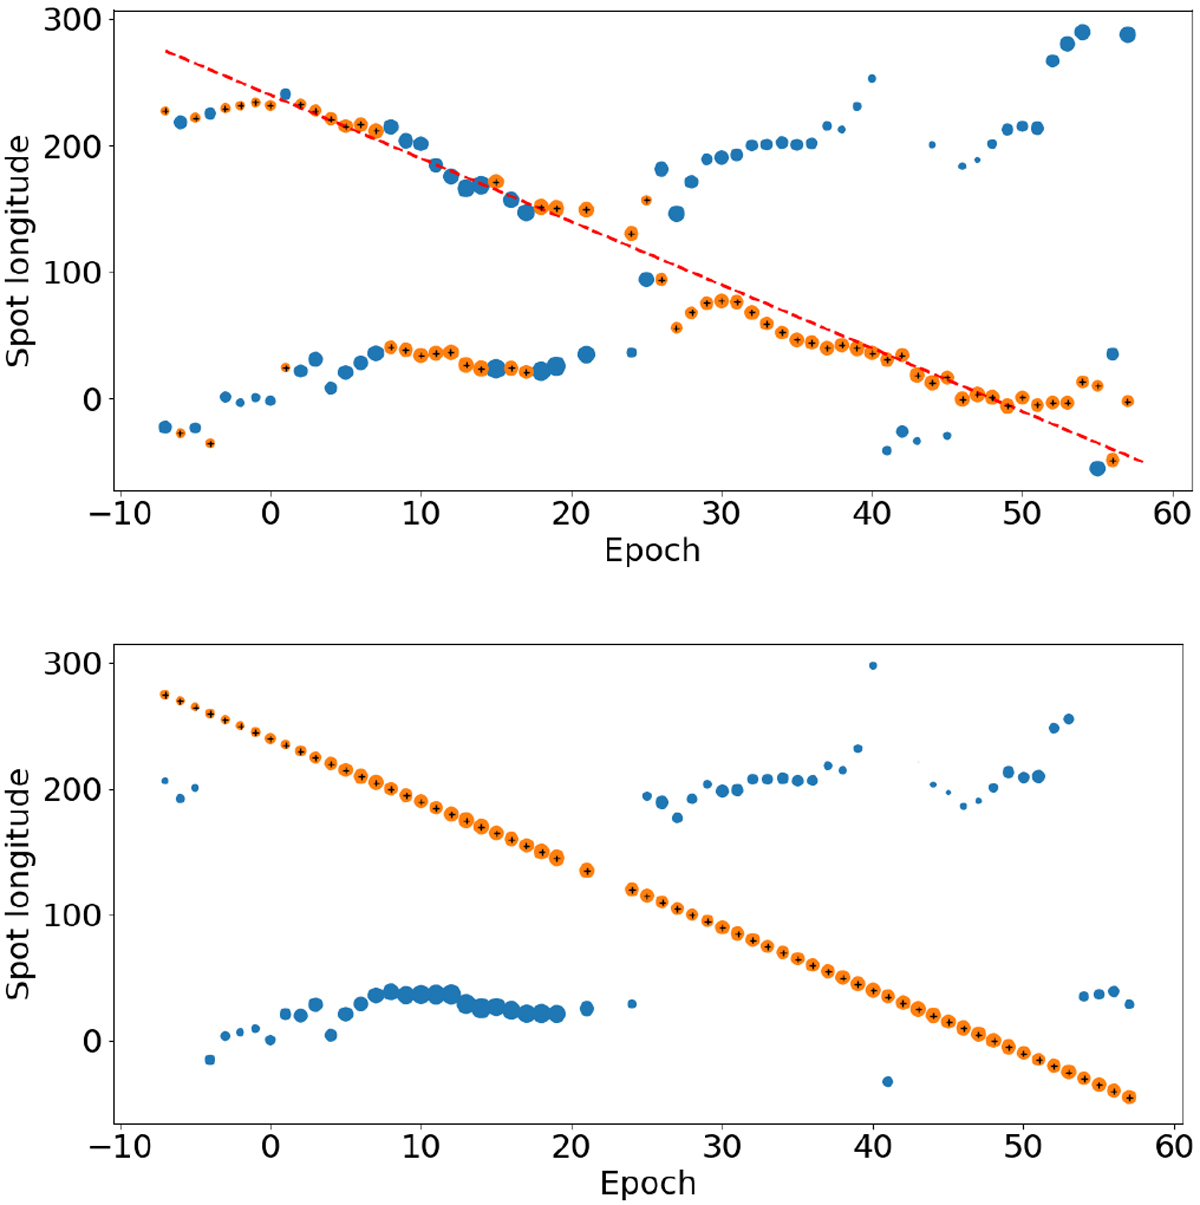
Time evolution of spot longitudes in the two-spot model. The primary and secondary spots are indicated by orange circles and blue circles, respectively; an additional cross marks the secondary spot. Upper panel: model without longitudinal constraints. Evolution from one-spot model (Eq. (5)) as dashed, red line. Bottom panel: two-spot model with secondary spot longitude fixed according to Eq. (5).
Current usage metrics show cumulative count of Article Views (full-text article views including HTML views, PDF and ePub downloads, according to the available data) and Abstracts Views on Vision4Press platform.
Data correspond to usage on the plateform after 2015. The current usage metrics is available 48-96 hours after online publication and is updated daily on week days.
Initial download of the metrics may take a while.