Fig. 7
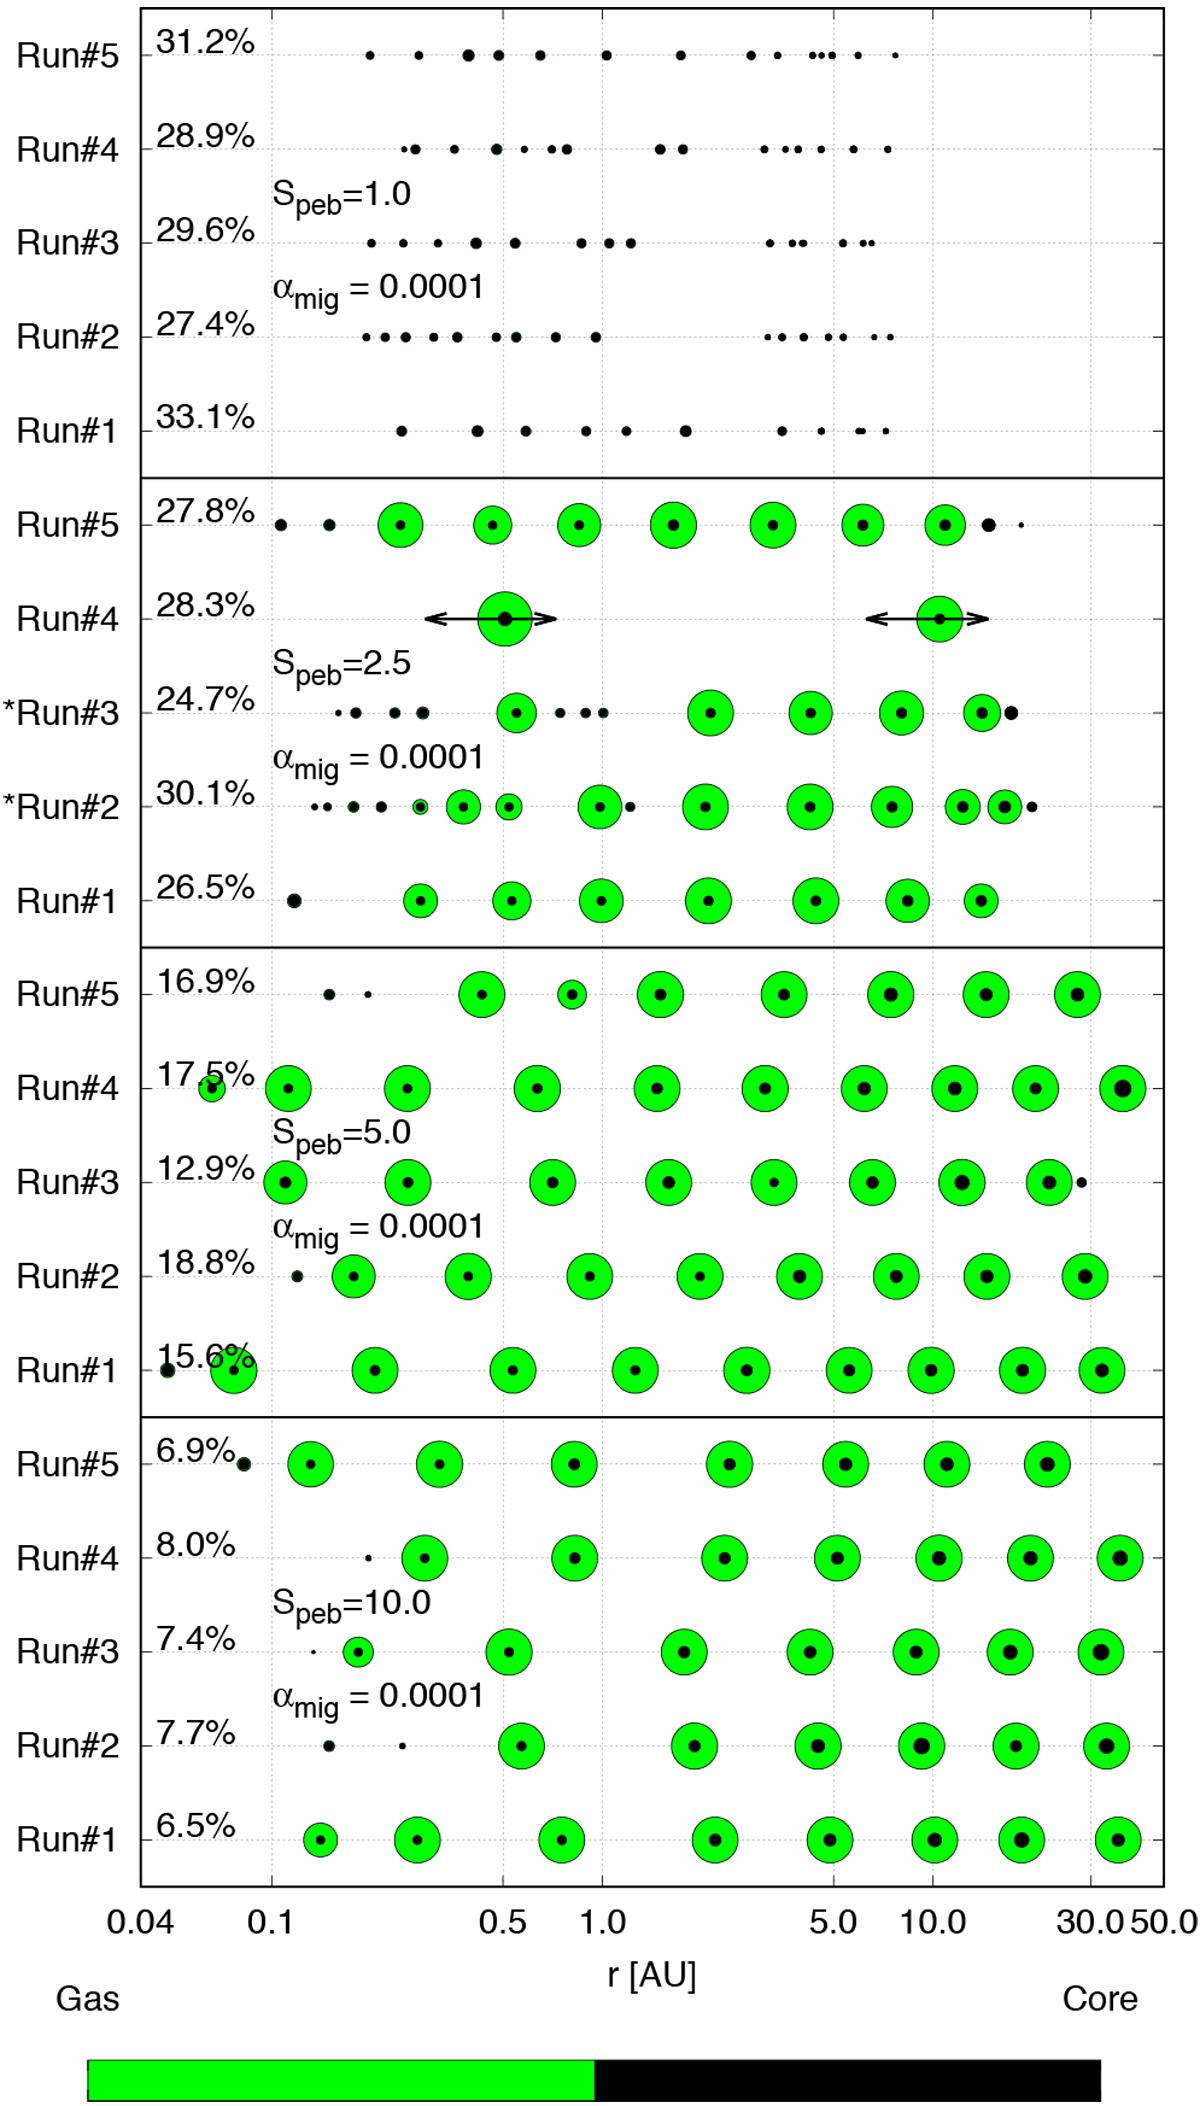
Final configurations after 8 Myr of integration of all our simulations with αmig = 0.0001 and different pebble fluxes. The size of the circle is proportional to the total planetary mass (green) by the third root and to the mass of the planetary core (black) also by the third root. The runs marked with * are the example long-term runs shown in Figs. 8 and 9, while the black arrows indicate the aphelion and perihelion positions of the planet calculated through rP ± e × rP. The percentage numbers in front show the pebble-to-planet conversion ratio fp2p, which is discussed in Sect. 6.
Current usage metrics show cumulative count of Article Views (full-text article views including HTML views, PDF and ePub downloads, according to the available data) and Abstracts Views on Vision4Press platform.
Data correspond to usage on the plateform after 2015. The current usage metrics is available 48-96 hours after online publication and is updated daily on week days.
Initial download of the metrics may take a while.