Fig. 6
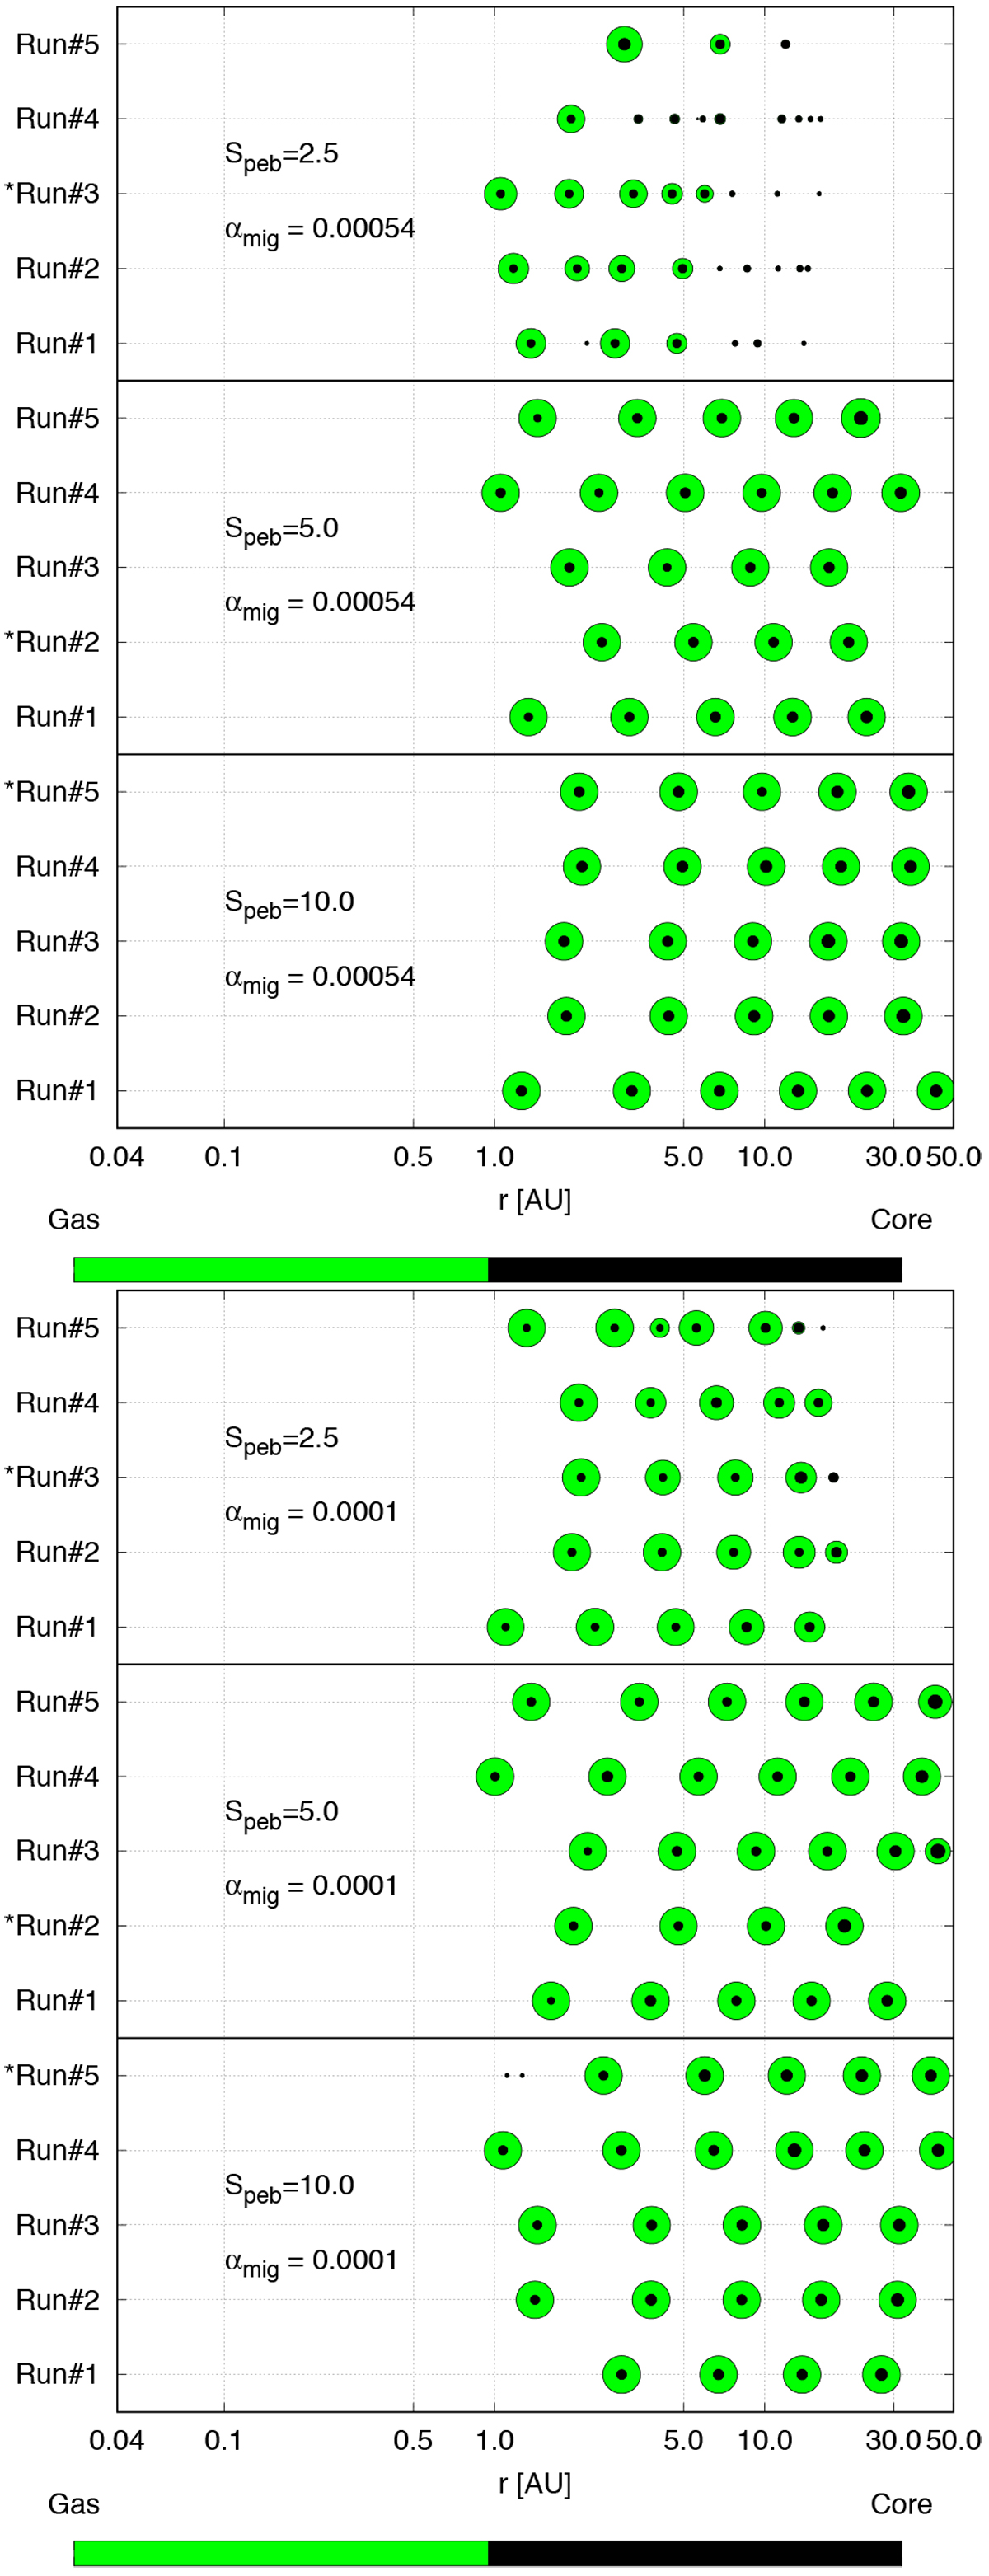
Final configurations after 8 Myr of integration of all our simulations with αmig = 0.00054 (top panel) and αmig = 0.0001 (bottom panel) for different pebble fluxes as marked in the figure. Planets migrating interior to 1 AU are removed from the simulations here. We only show planets with masses above 0.3 ME. The size of the circle is proportional to the total planetary mass (green) by the third root and to the mass of the planetary core (black) also by the third root. The runs marked with * are the example runs shown in Figs. 4 and 5.
Current usage metrics show cumulative count of Article Views (full-text article views including HTML views, PDF and ePub downloads, according to the available data) and Abstracts Views on Vision4Press platform.
Data correspond to usage on the plateform after 2015. The current usage metrics is available 48-96 hours after online publication and is updated daily on week days.
Initial download of the metrics may take a while.