Fig. 3
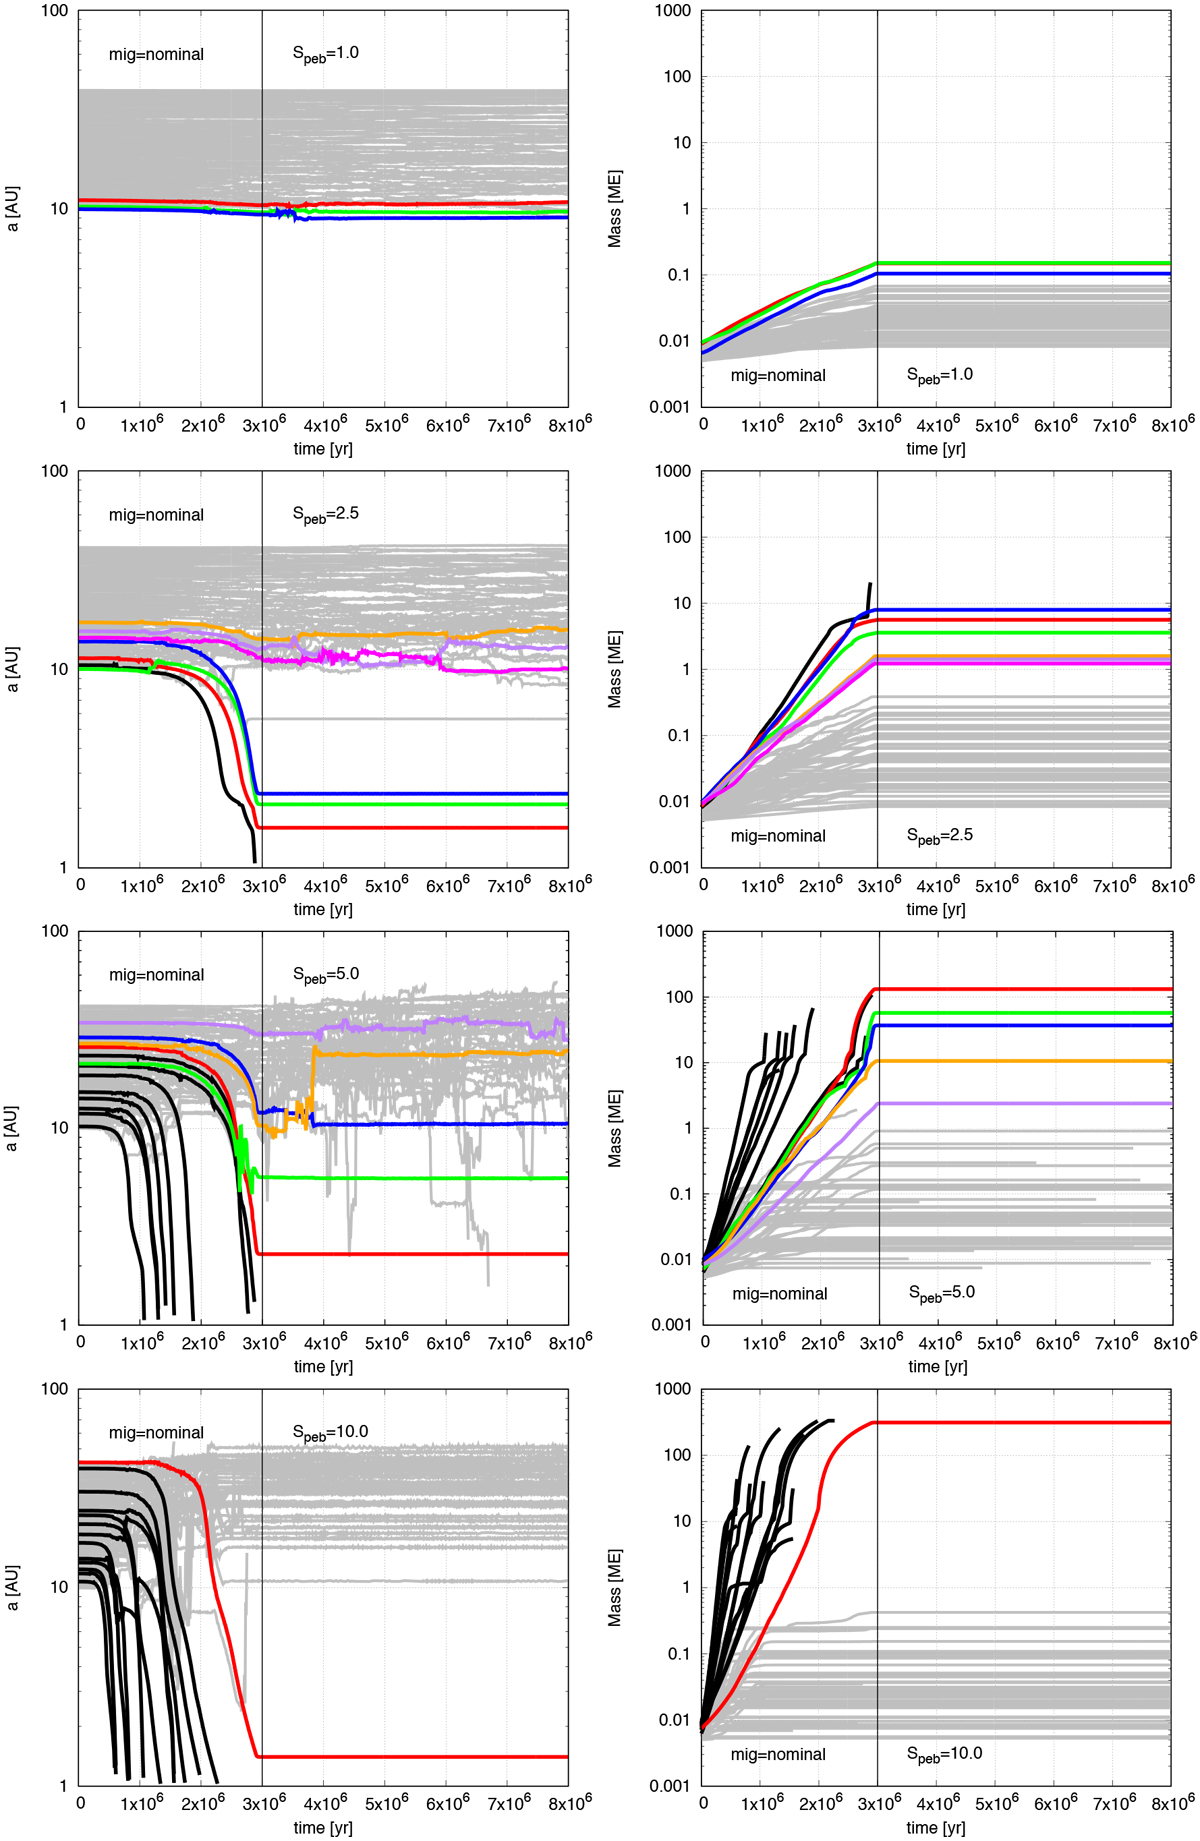
Evolution of planetary systems with different pebble fluxes (Speb = 1.0, 2.5, 5.0 and 10.0, top to bottom panels) and nominal migration rate in time. Semi-major axis (left panels) and planetary mass (right panels) of 60 planetary embryos as function of time. The gas disc lifetime is 3 Myr after injection of the planetary embryos. Here the innermost embryo is placed at 10 AU, so further away than in Fig. 2. As before, black lines correspond to bodies that migrate to the inner disc interior of 1 AU via type-I migration, bodies shown in grey are either not growing much or are ejected via gravitational interactions. The bodies shown in colours are the most massive surviving bodies in the simulation.
Current usage metrics show cumulative count of Article Views (full-text article views including HTML views, PDF and ePub downloads, according to the available data) and Abstracts Views on Vision4Press platform.
Data correspond to usage on the plateform after 2015. The current usage metrics is available 48-96 hours after online publication and is updated daily on week days.
Initial download of the metrics may take a while.