Fig. 4.
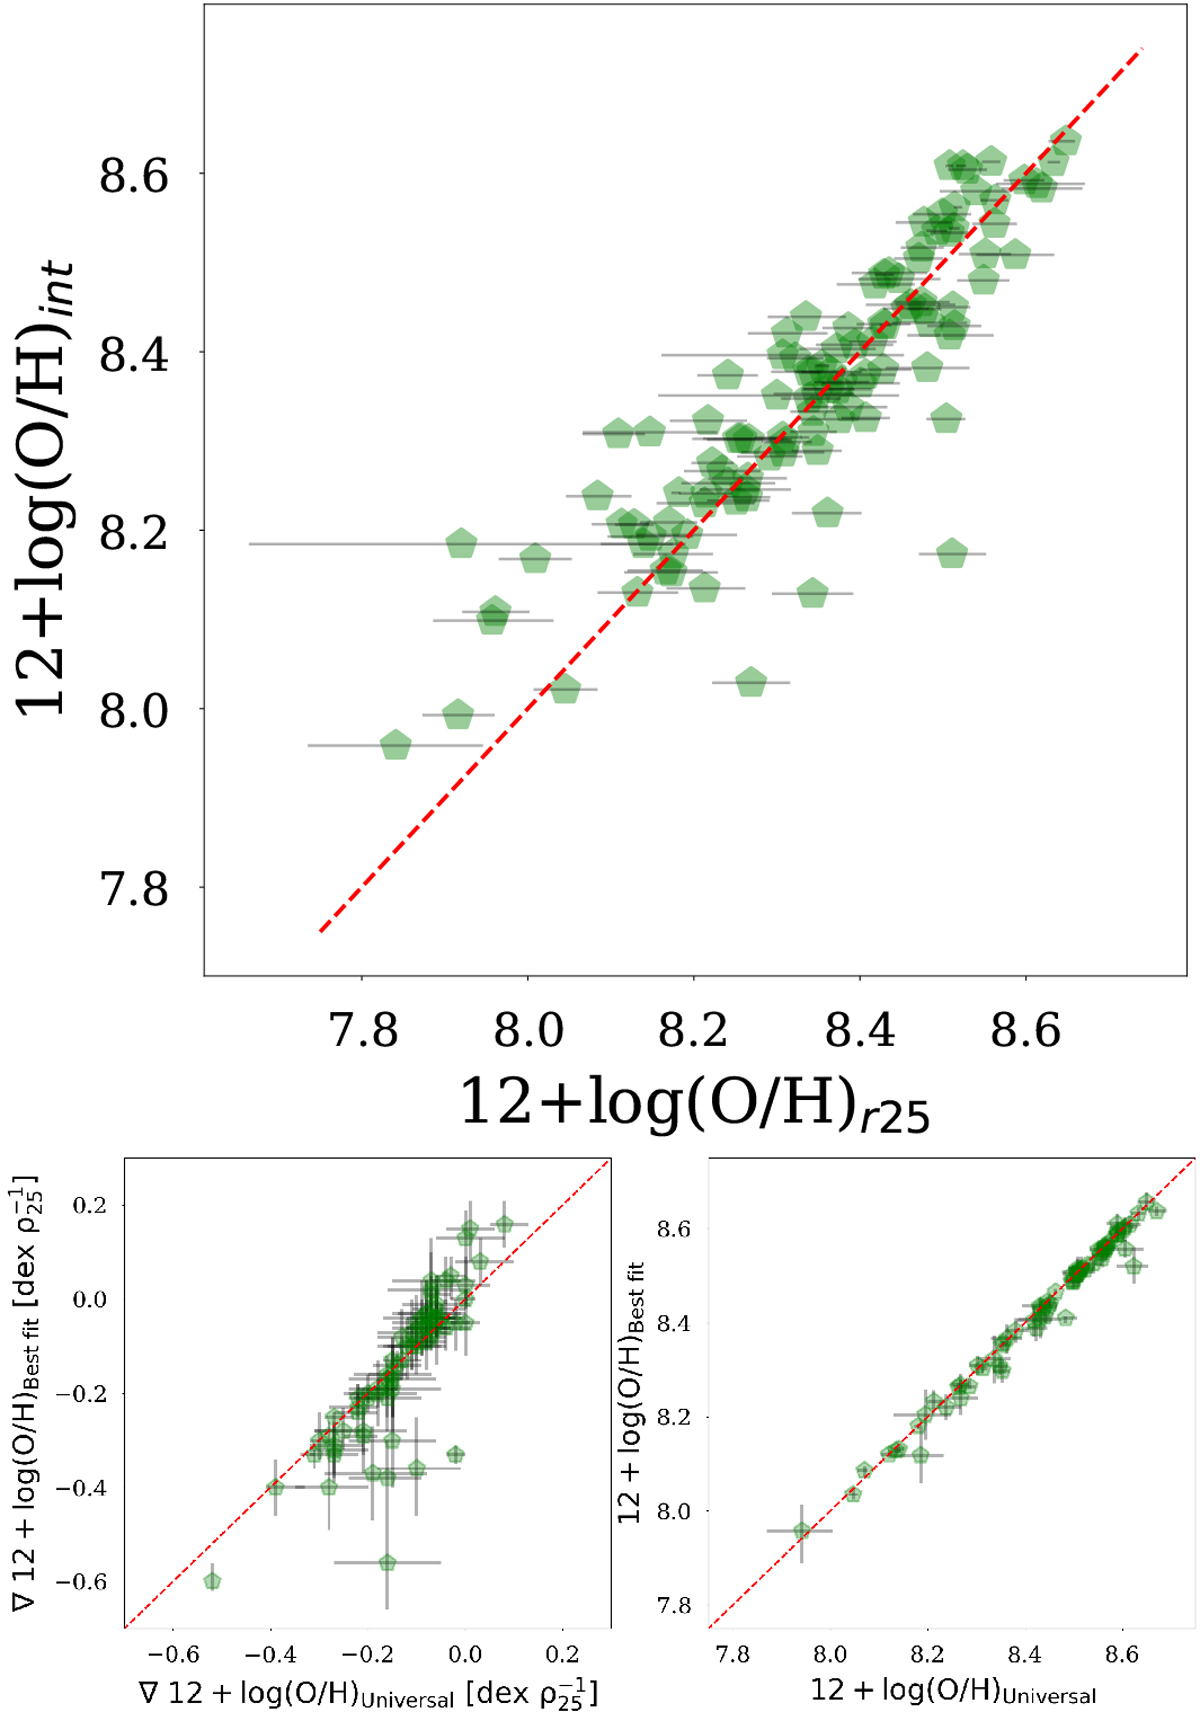
Top panel: comparison of the characteristic metallicity 12+log(O/H)r25 (Bayesian estimate of the metallicity at a radius of 0.4 r25) and the metallicity from integrated spectroscopy 12+log(O/H)int for all the galaxies where both estimates are available. The red dashed line gives the one-to-one relation. Bottom panels: comparison of the gradients (left panel) and characteristic metallicities (right panel) for the well constrained sample, comparing the best fit method that is used in this work, to the “universal prior” method that is used for the unconstrained sample (though here applied to the well constrained sample). The red dashed line gives the one-to-one relation. The characteristic metallicities are very independent on the method, though the “universal prior” gradients are somewhat biased towards the mean.
Current usage metrics show cumulative count of Article Views (full-text article views including HTML views, PDF and ePub downloads, according to the available data) and Abstracts Views on Vision4Press platform.
Data correspond to usage on the plateform after 2015. The current usage metrics is available 48-96 hours after online publication and is updated daily on week days.
Initial download of the metrics may take a while.