Fig. 3.
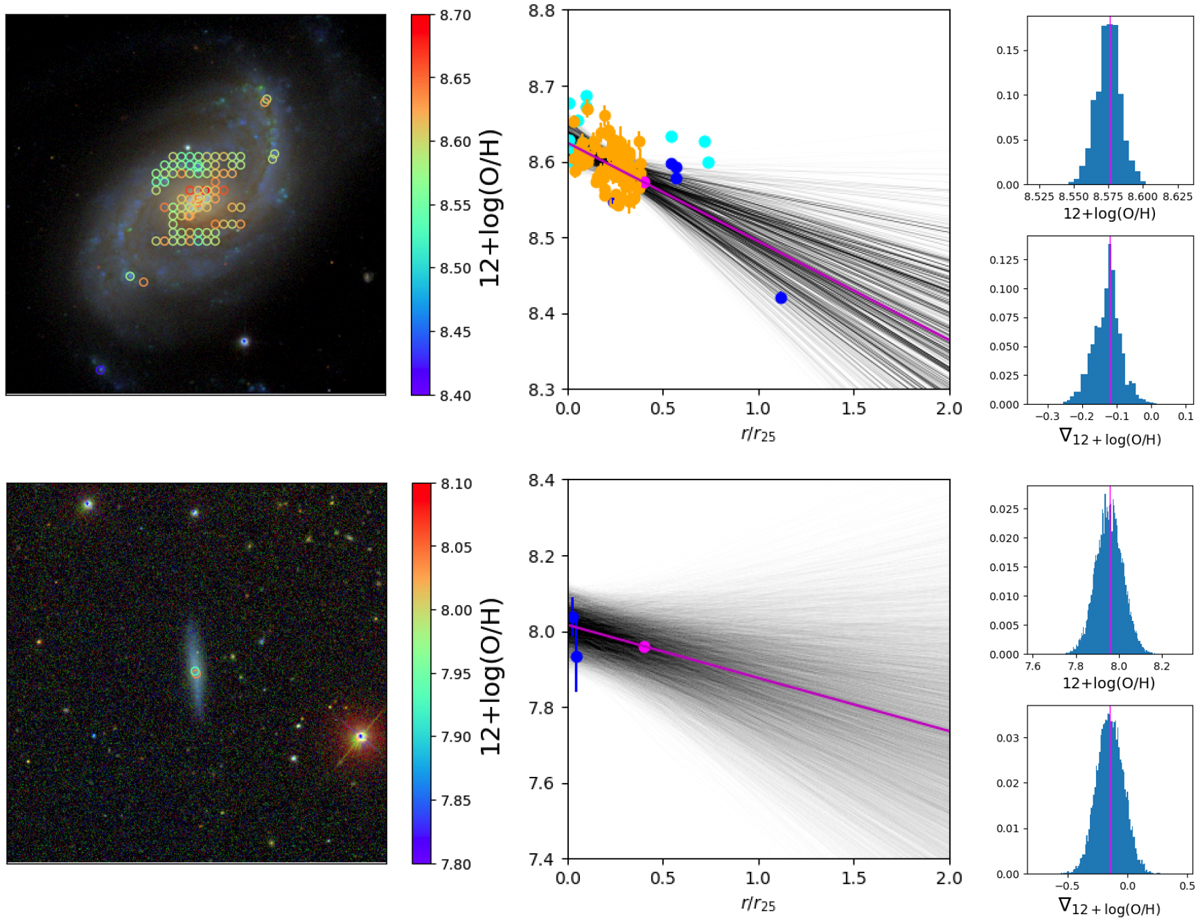
Left panels: 4.5 × 4.5 arcmin2 SDSS gri colour image together with the distribution of metals (coloured circles) in NGC 5248 (well sampled; top panel) and UGC 00931 (sparsely sampled; bottom panel). Middle panels: radial metallicity profile for both galaxies. MUSE data points are shown in orange, literature data with measured uncertainties in blue and literature data without measured uncertainty (uncertainty of 0.2 dex was assigned) in cyan. The magenta line gives the best radial fit and the black lines give the 30 000 individual fits attempted in our Bayesian approach, weighted by their probability from Eq. (5). Right panels: the resulting PDFs for the gradient ∇12+log(O/H) and characteristic metallicity. The median is shown in magenta (see also middle panel) and is used for the remainder of this work.
Current usage metrics show cumulative count of Article Views (full-text article views including HTML views, PDF and ePub downloads, according to the available data) and Abstracts Views on Vision4Press platform.
Data correspond to usage on the plateform after 2015. The current usage metrics is available 48-96 hours after online publication and is updated daily on week days.
Initial download of the metrics may take a while.