Fig. 6
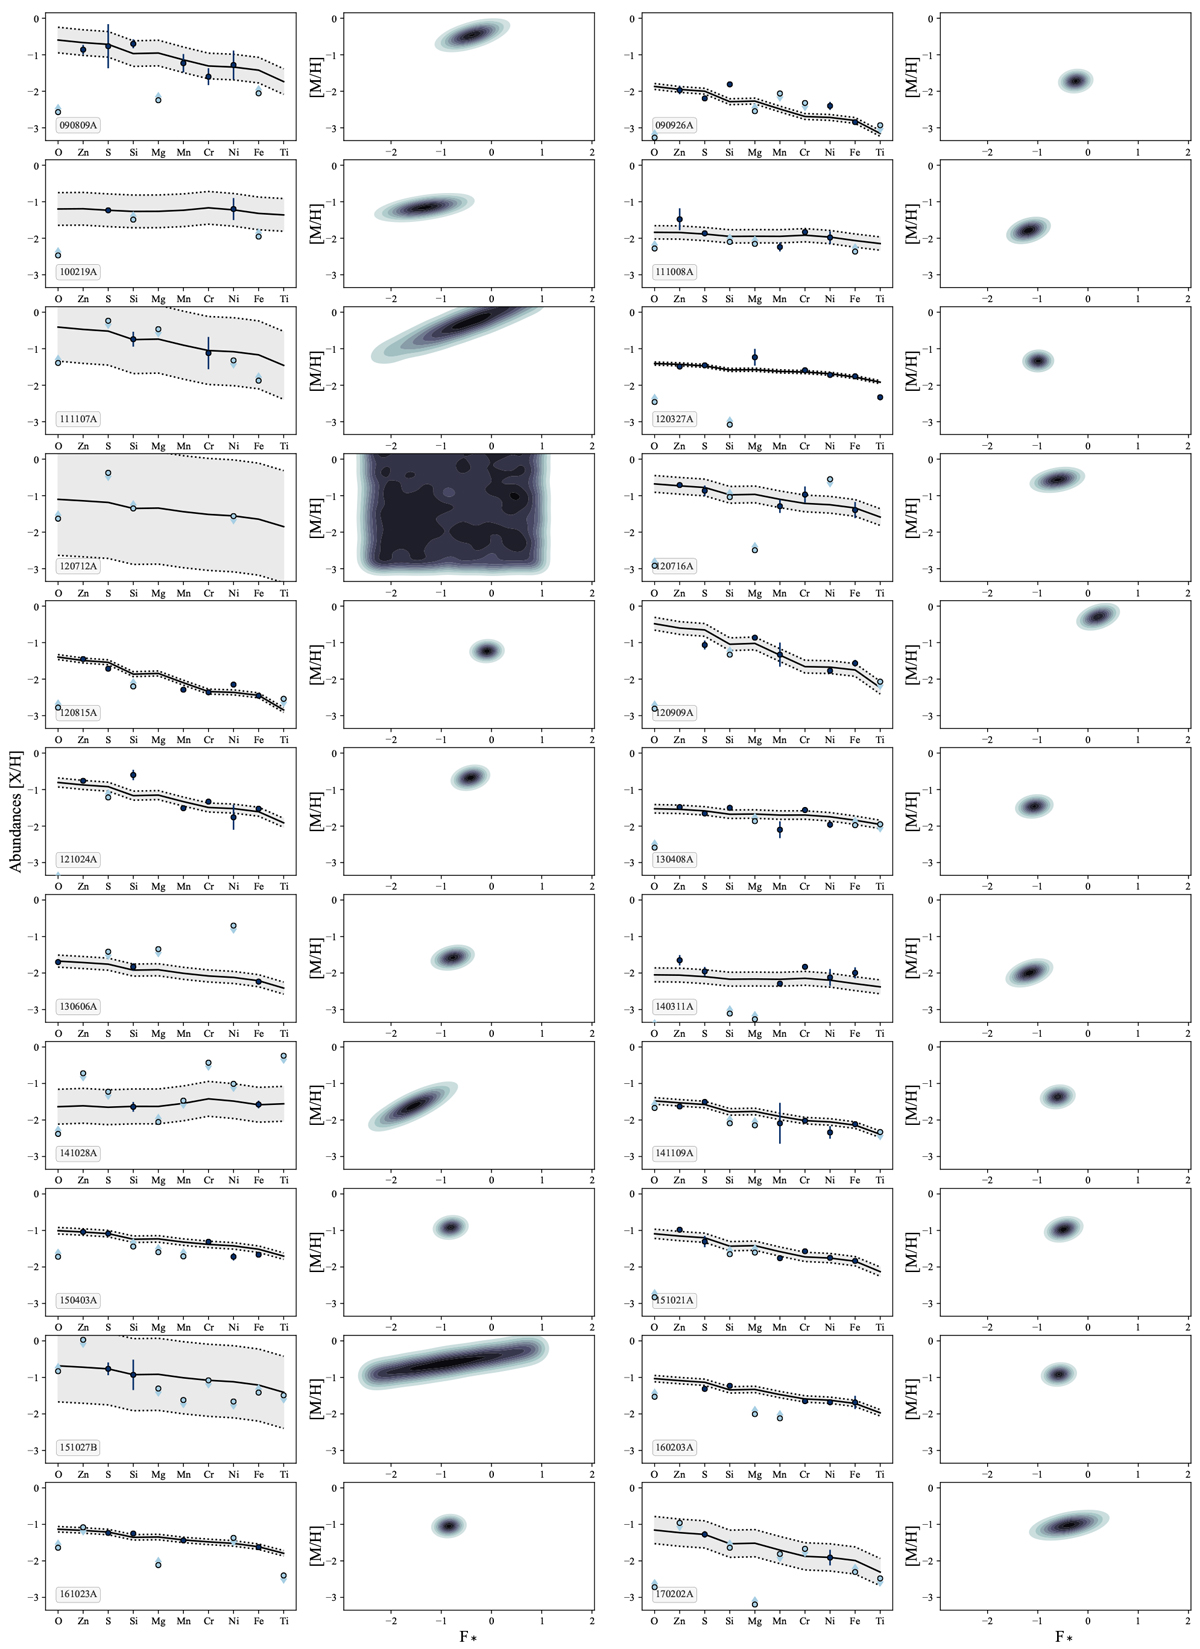
Results from fitting dust depletion sequences for the 22 GRBs in our H2 sample. The relatives abundances of the elements used for the fits are plotted with dark blue dots. Upper and lower limits for the other elements are plotted in light blue. The black line indicates the best FIT, and the dashed lines and gray shaded areas the corresponding 3-σ confidence intervals. A contour plot of dust-corrected metallicity [M/H] versus F* is shown right next to every depletion sequence.
Current usage metrics show cumulative count of Article Views (full-text article views including HTML views, PDF and ePub downloads, according to the available data) and Abstracts Views on Vision4Press platform.
Data correspond to usage on the plateform after 2015. The current usage metrics is available 48-96 hours after online publication and is updated daily on week days.
Initial download of the metrics may take a while.