Fig. 4
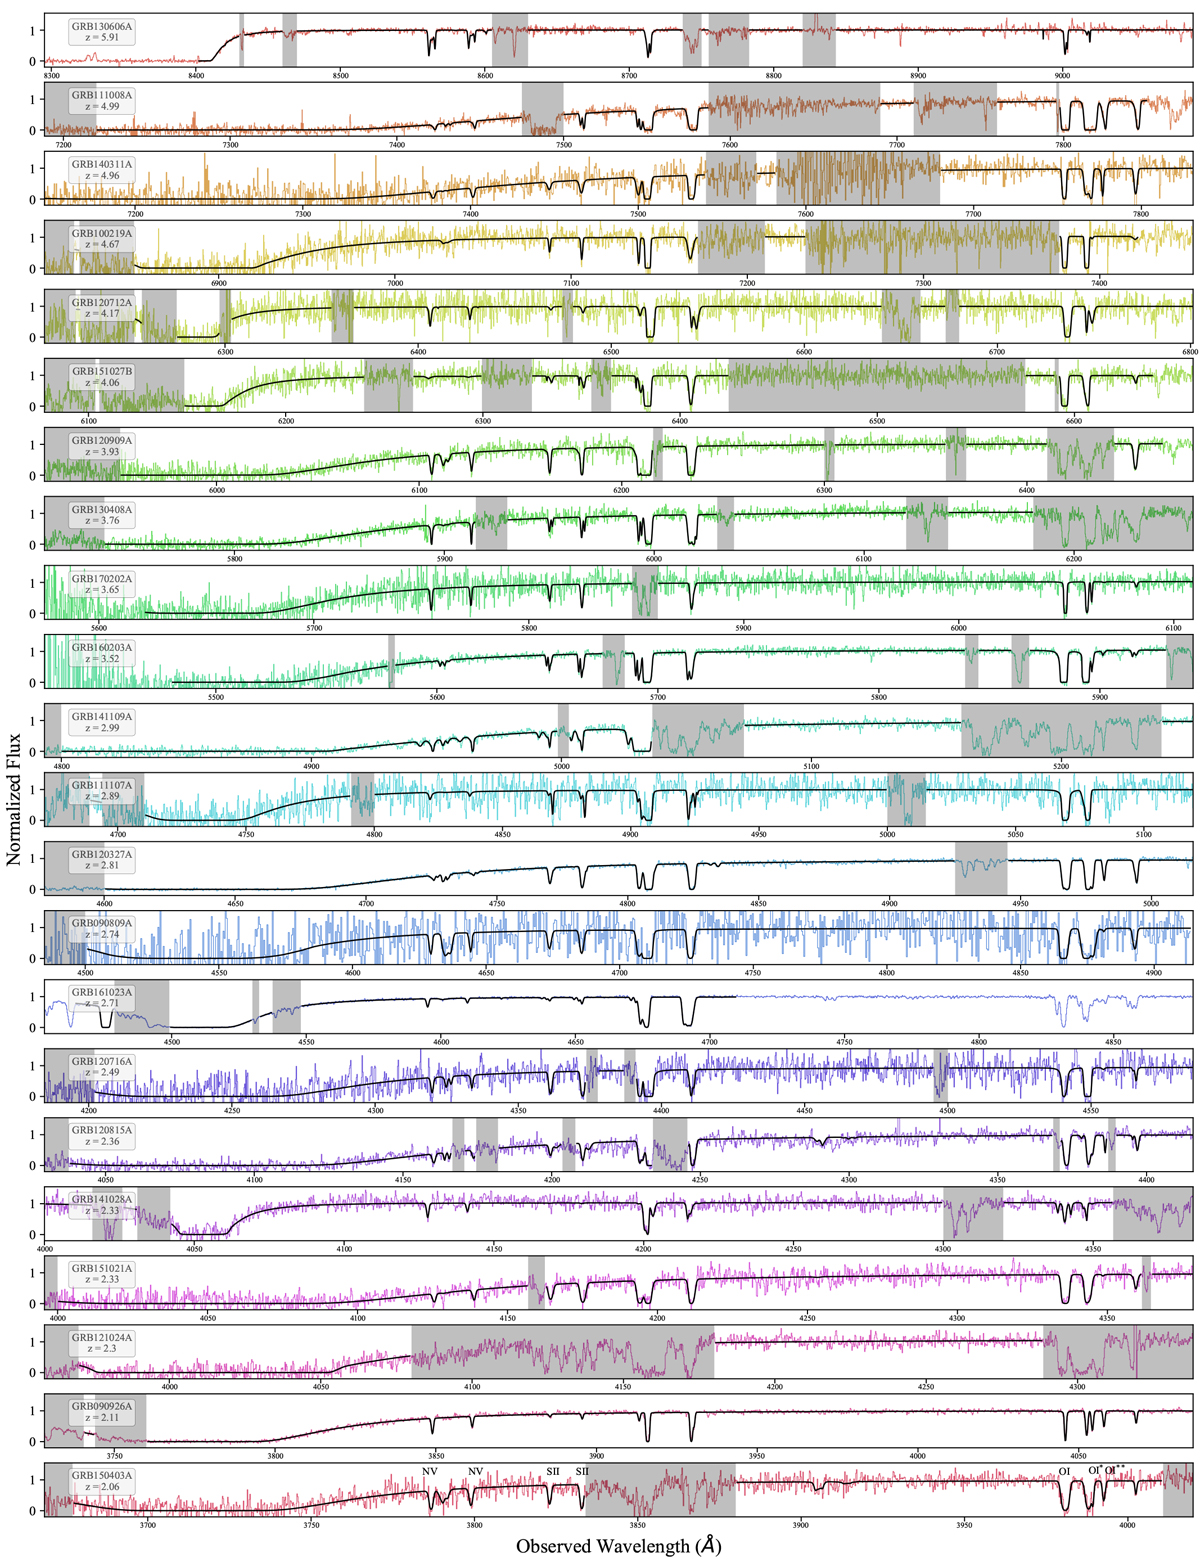
Normalized X-shooter spectra around the observed Lyman-α absorption lines for the 22 GRB afterglows analysed in this paper ordered by decreasing redshifts from top to bottom panels. The best-fit model is shown in each case by a solid black line. The gray shaded areas indicate the regions that were masked out during the fits, usually due to the interposition of telluric lines or complex absorbing structures.
Current usage metrics show cumulative count of Article Views (full-text article views including HTML views, PDF and ePub downloads, according to the available data) and Abstracts Views on Vision4Press platform.
Data correspond to usage on the plateform after 2015. The current usage metrics is available 48-96 hours after online publication and is updated daily on week days.
Initial download of the metrics may take a while.