Fig. B.20
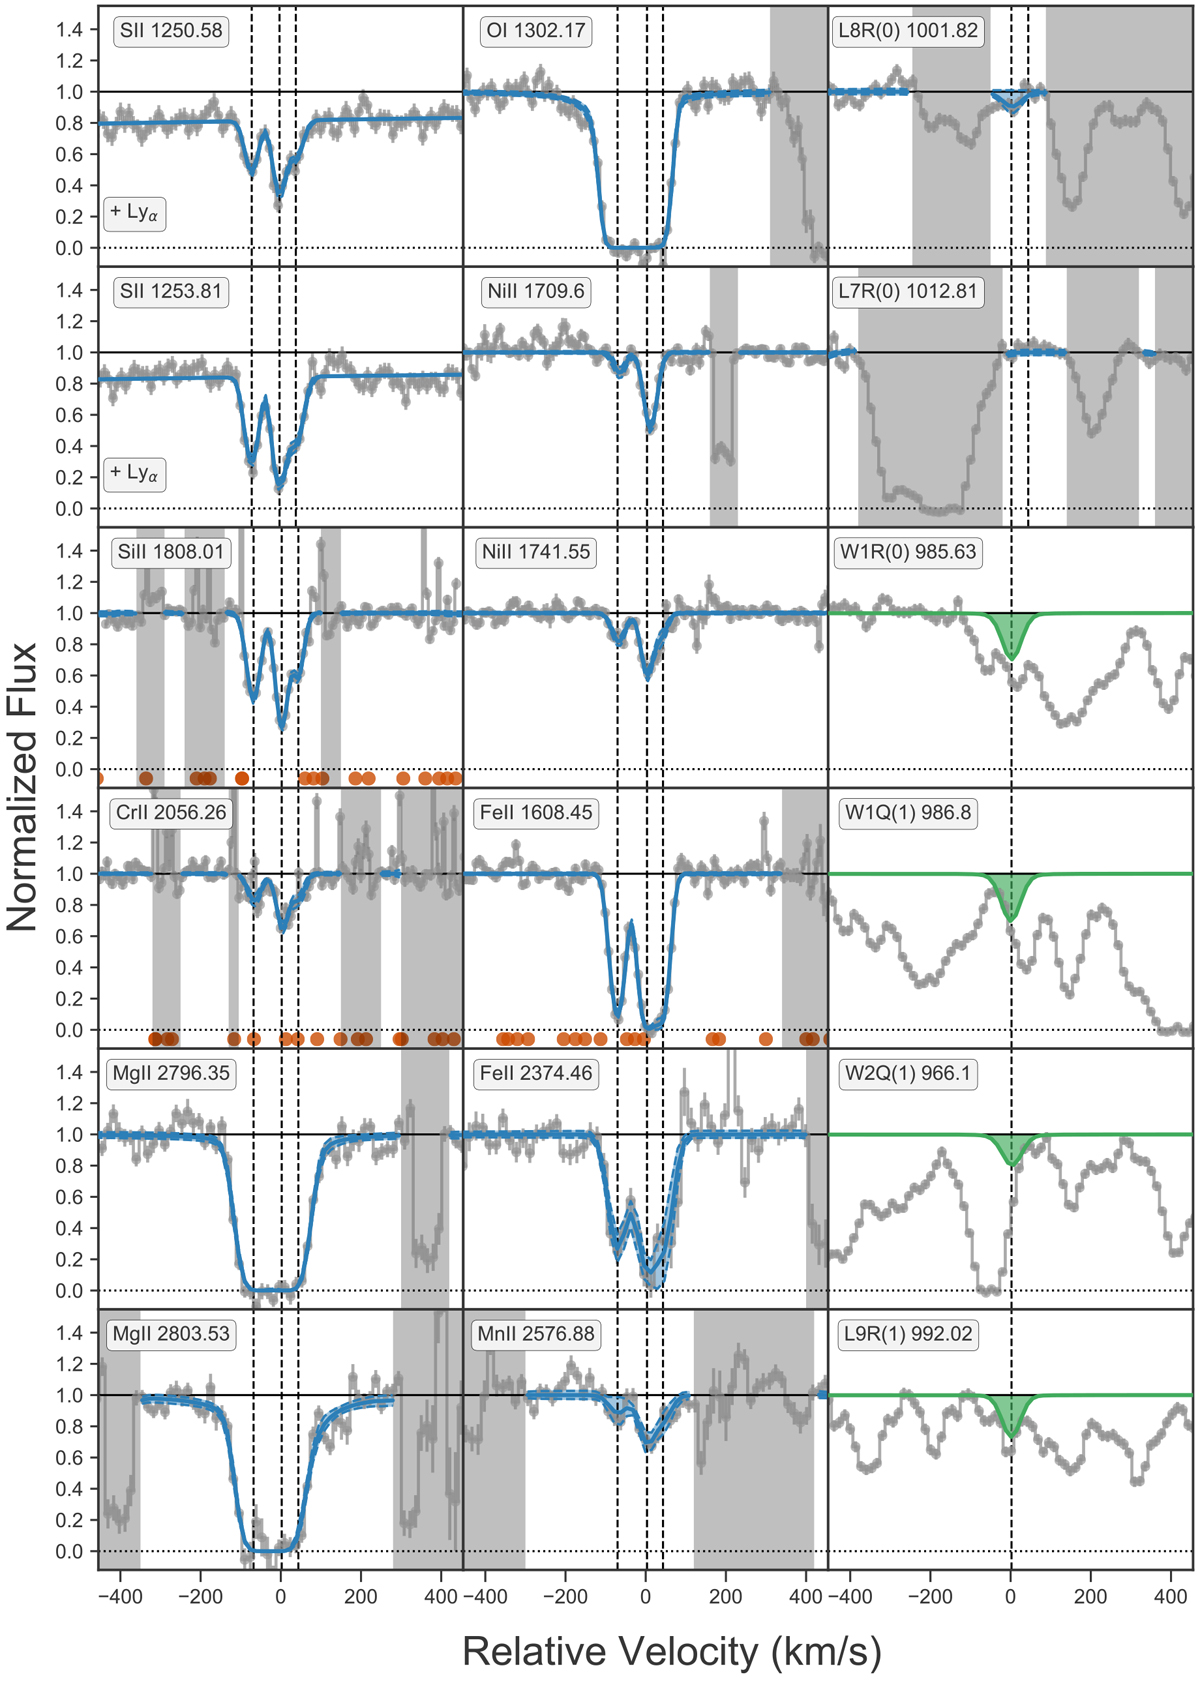
Results from fitting absorption lines in the X-shooter spectrum of GRB 160203A. The position of telluric lines, which were corrected, are marked by red dots. As shown in the 6 subplots to the right, the spectrum is consistent with absorption from molecular hydrogen, but only to the degree of claiming a possible detection. In green, we plot synthetic spectra for the upper limits given in Table A.2.
Current usage metrics show cumulative count of Article Views (full-text article views including HTML views, PDF and ePub downloads, according to the available data) and Abstracts Views on Vision4Press platform.
Data correspond to usage on the plateform after 2015. The current usage metrics is available 48-96 hours after online publication and is updated daily on week days.
Initial download of the metrics may take a while.