Fig. 14
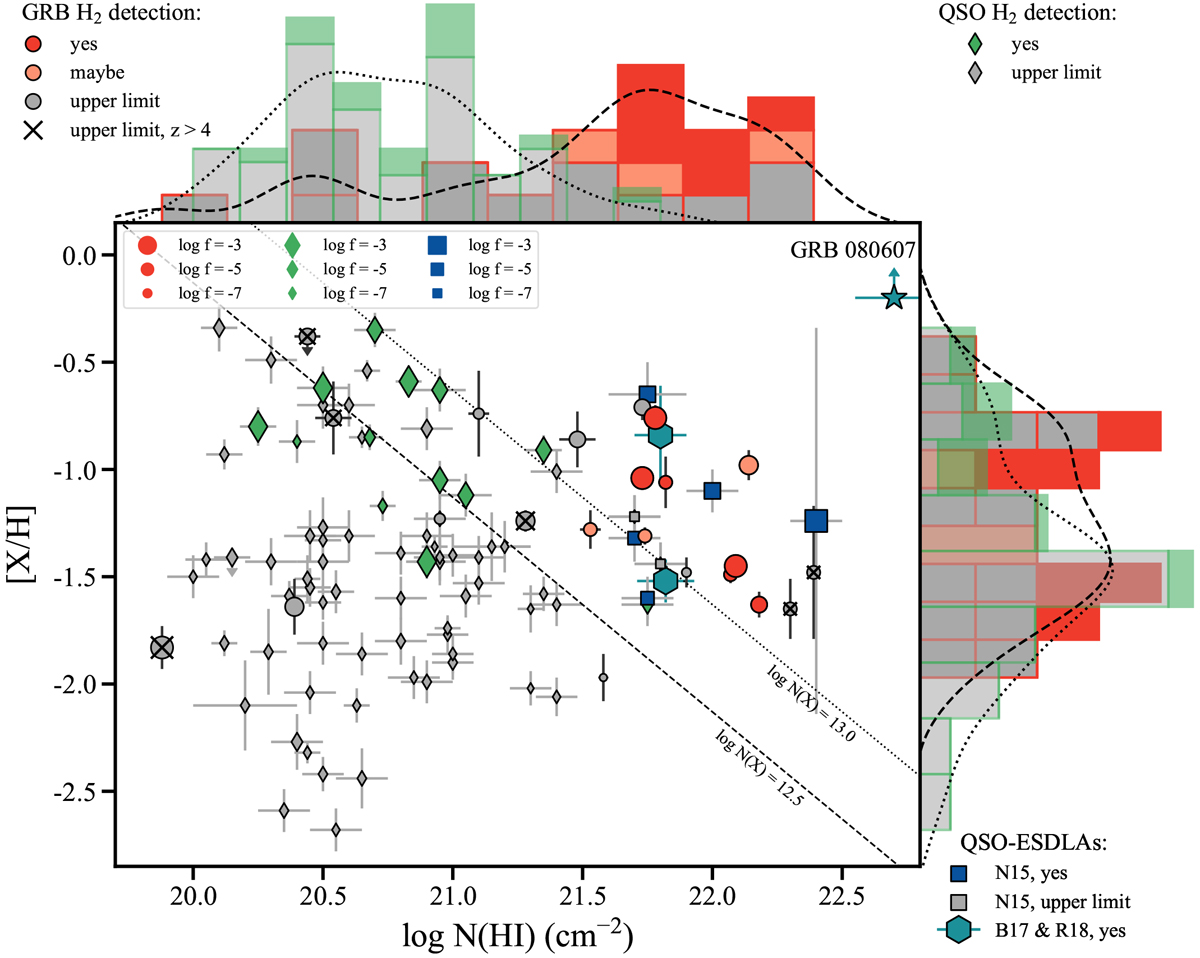
Metallicity versus neutral atomic-hydrogen column density for the GRB-DLAs in our sample and the QSO-DLAs from Noterdaeme et al. (2008, 2015a; N15). Also shown are the two extremely strong QSO-DLAs from Balashev et al. (2017; B17) and Ranjan et al. (2018; B18). When molecular hydrogen is detected, the data points are colored (GRB-DLAs in red, QSO-DLAs in green and blue, as labeled). The symbol size represents the overall molecular fraction log f, and in case of a non-detection the corresponding upper limit. The GRB-DLAs at z > 4 are additionally marked with a cross. The dotted and dashed lines represent a constant metal column density of log N(X) = 12.5 and log N(X) = 13.0, respectively. Above and to the right of the scatter plot, we show the histograms and corresponding kernel density estimates for our GRB-DLAs and the N08 QSO-DLA sample. Systems with H2 detections are colored as labeled.
Current usage metrics show cumulative count of Article Views (full-text article views including HTML views, PDF and ePub downloads, according to the available data) and Abstracts Views on Vision4Press platform.
Data correspond to usage on the plateform after 2015. The current usage metrics is available 48-96 hours after online publication and is updated daily on week days.
Initial download of the metrics may take a while.