Fig. 12
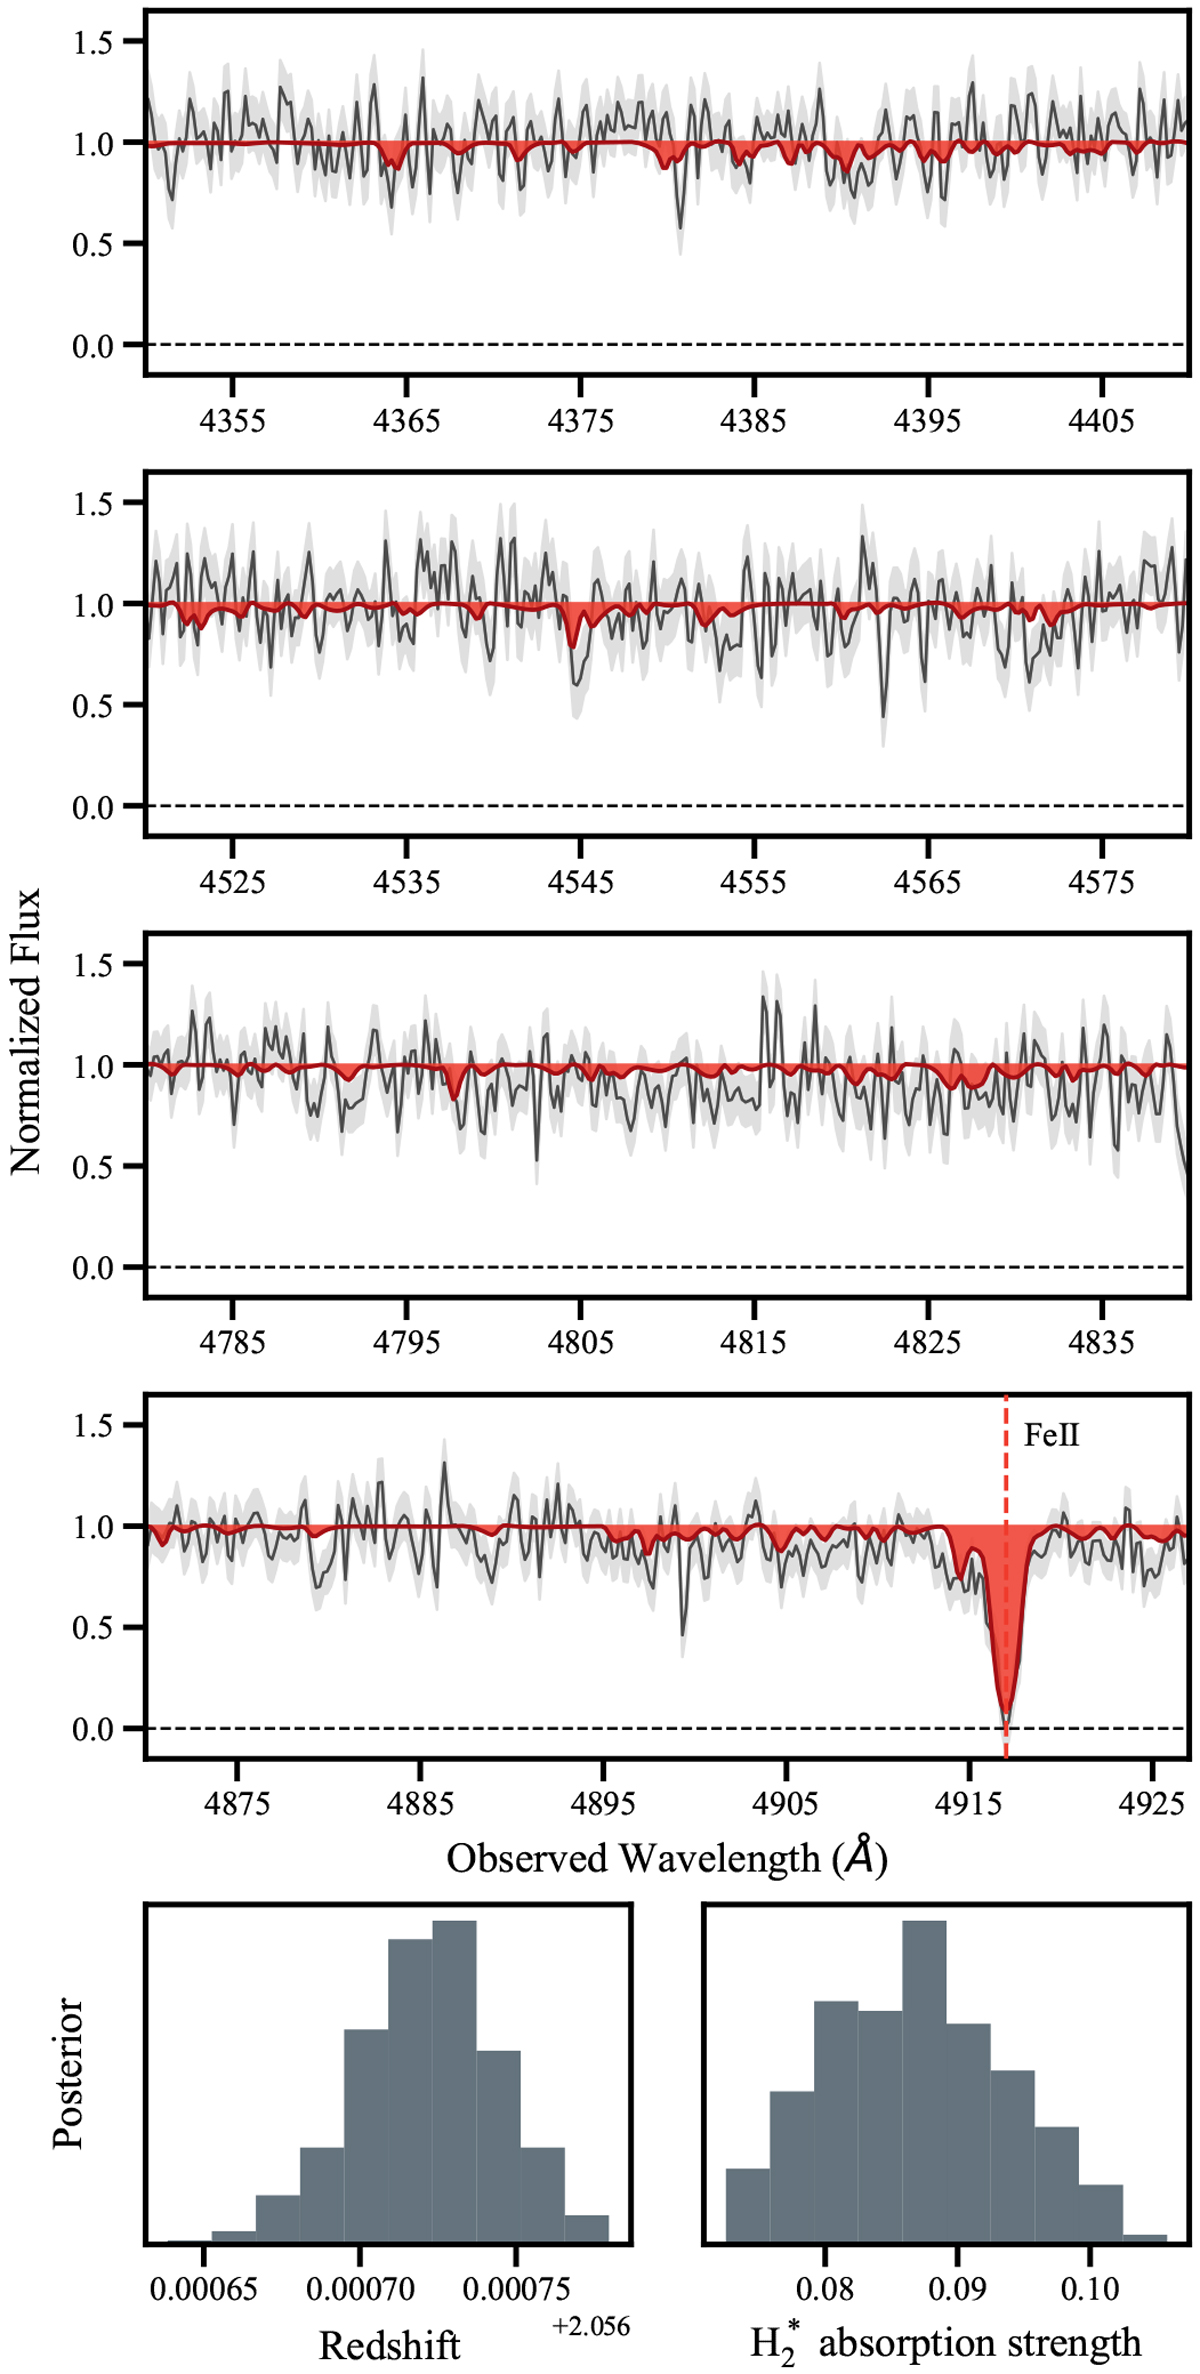
Normalized spectrum of GRB 150403A showing tentative evidence for absorption from vibrationally excited molecular hydrogen, H![]() . The model is indicated by the solid red line. In the insets at the bottom, we show the posterior distribution of the redshift
z
and the H
. The model is indicated by the solid red line. In the insets at the bottom, we show the posterior distribution of the redshift
z
and the H![]() absorption strength from the Draine & Hao (2002) model that we fitted to the data. An intervening absorption line from
Fe II is indicated by the dashed orange line.
absorption strength from the Draine & Hao (2002) model that we fitted to the data. An intervening absorption line from
Fe II is indicated by the dashed orange line.
Current usage metrics show cumulative count of Article Views (full-text article views including HTML views, PDF and ePub downloads, according to the available data) and Abstracts Views on Vision4Press platform.
Data correspond to usage on the plateform after 2015. The current usage metrics is available 48-96 hours after online publication and is updated daily on week days.
Initial download of the metrics may take a while.