Free Access
Fig. 11
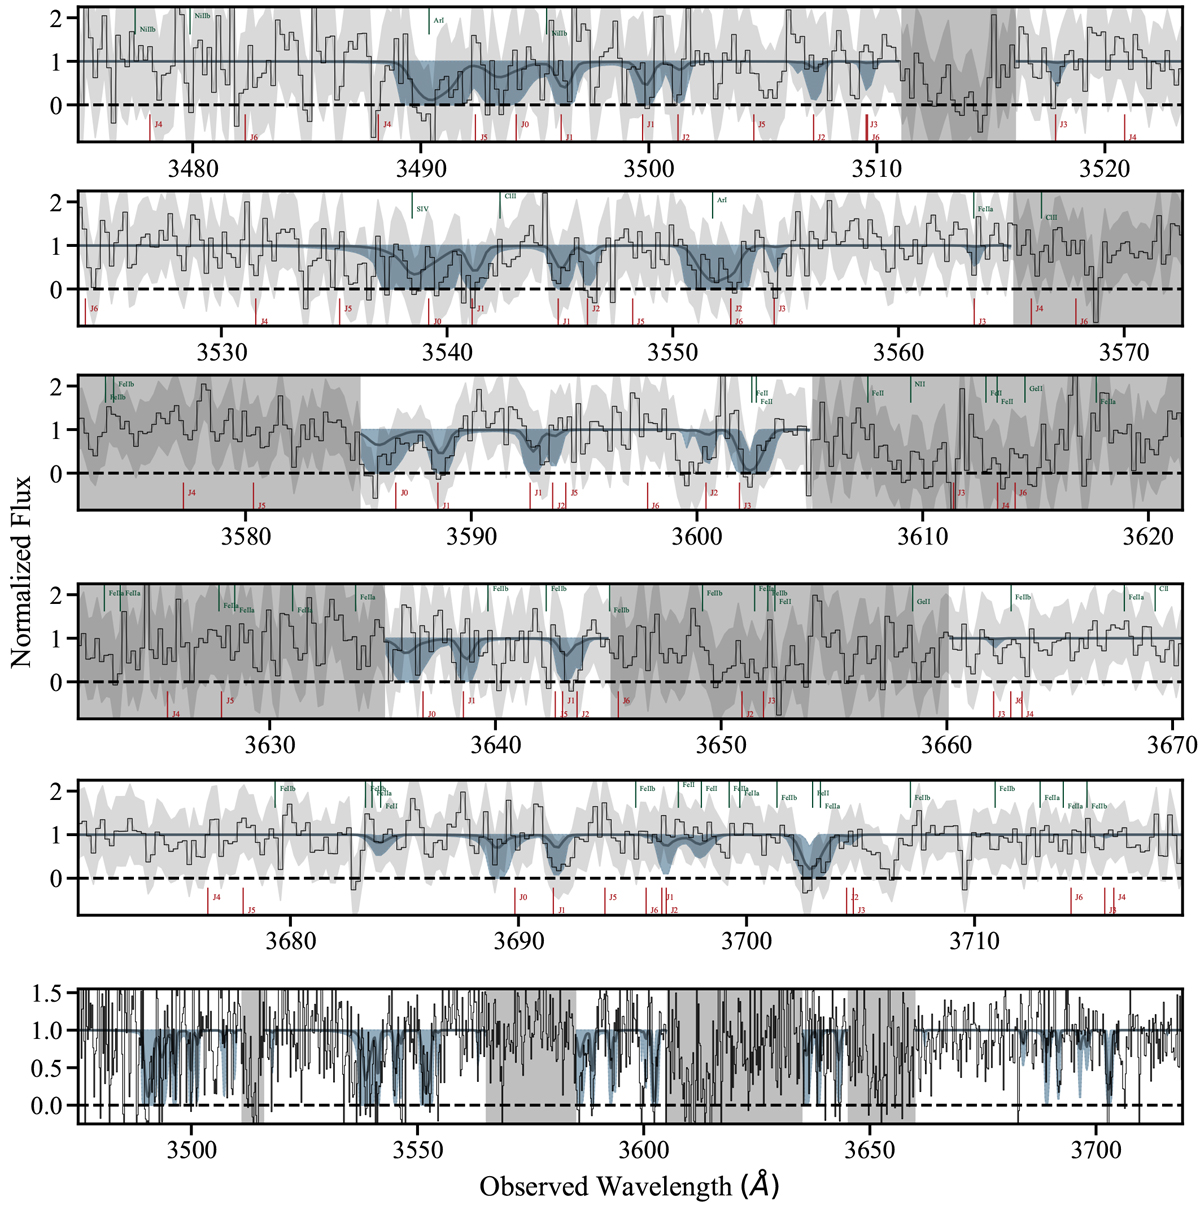
X-shooter spectrum of GRB 151021A covering Lyman- and Werner-band absorption lines of molecular hydrogen. The best-fit model is indicated by the solid blue lines and the corresponding 3-σ confidence intervals by the blue shaded regions. Gray shaded regions were ignored during the FIT.
Current usage metrics show cumulative count of Article Views (full-text article views including HTML views, PDF and ePub downloads, according to the available data) and Abstracts Views on Vision4Press platform.
Data correspond to usage on the plateform after 2015. The current usage metrics is available 48-96 hours after online publication and is updated daily on week days.
Initial download of the metrics may take a while.