Fig. 5.
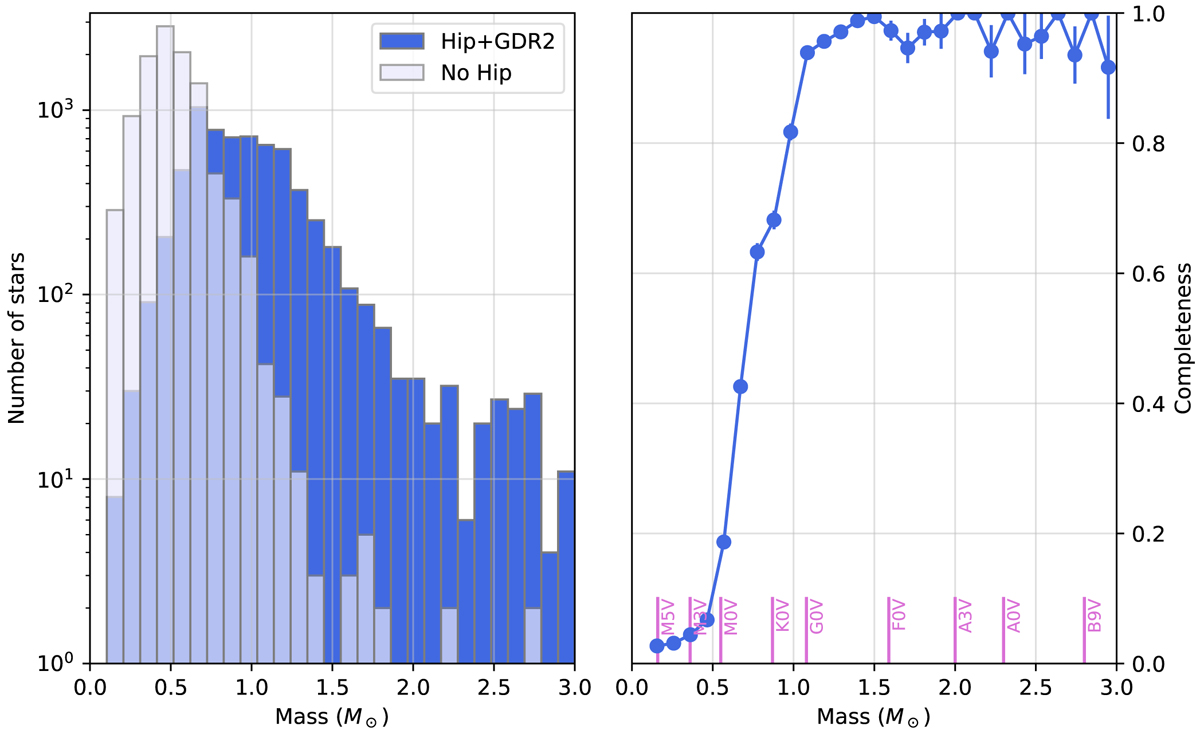
Left panel: histogram of the masses of the stars of our 50 pc sample that are present in the HIPPARCOS and GDR2 catalogs (dark blue histogram) and that are present in the GDR2 (with G < 13) but absent from Hip2 (light blue histogram). Right panel: completeness level of the sample of stars tested for the presence of a PMa as a function of their mass. The corresponding spectral types on the main sequence are shown in pink. The error bars represent the binomial proportion 68% confidence interval.
Current usage metrics show cumulative count of Article Views (full-text article views including HTML views, PDF and ePub downloads, according to the available data) and Abstracts Views on Vision4Press platform.
Data correspond to usage on the plateform after 2015. The current usage metrics is available 48-96 hours after online publication and is updated daily on week days.
Initial download of the metrics may take a while.