Fig. 11.
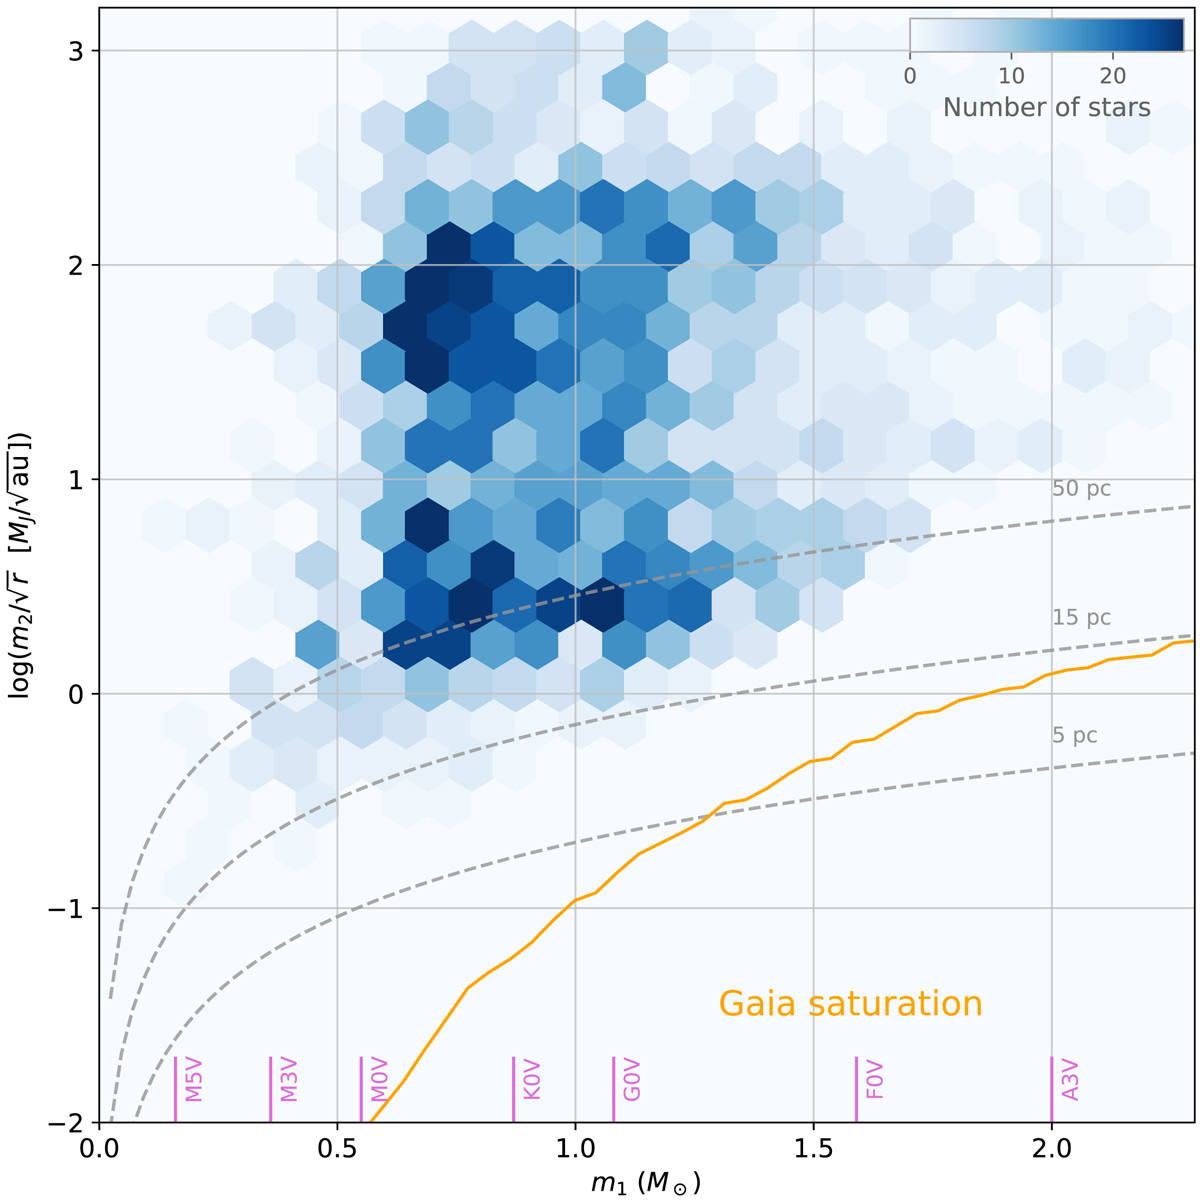
2D histogram of the estimated normalized masses ![]() as a function of the primary mass m1 for the stars exhibiting a PMa signal-to-noise ratio ΔG2 > 2. The normalized companion mass detection limits for the GDR2 for a star located at distances of 5, 15, and 50 pc are shown with dashed gray curves (see Sect. 3.7 for details). The area below the orange curve is the companion sensitivity domain excluded by the saturation limit of Gaia (G ≈ 3), considering the mass-luminosity relation of main sequence stars from Pecaut & Mamajek (2013).
as a function of the primary mass m1 for the stars exhibiting a PMa signal-to-noise ratio ΔG2 > 2. The normalized companion mass detection limits for the GDR2 for a star located at distances of 5, 15, and 50 pc are shown with dashed gray curves (see Sect. 3.7 for details). The area below the orange curve is the companion sensitivity domain excluded by the saturation limit of Gaia (G ≈ 3), considering the mass-luminosity relation of main sequence stars from Pecaut & Mamajek (2013).
Current usage metrics show cumulative count of Article Views (full-text article views including HTML views, PDF and ePub downloads, according to the available data) and Abstracts Views on Vision4Press platform.
Data correspond to usage on the plateform after 2015. The current usage metrics is available 48-96 hours after online publication and is updated daily on week days.
Initial download of the metrics may take a while.