Fig. 6.
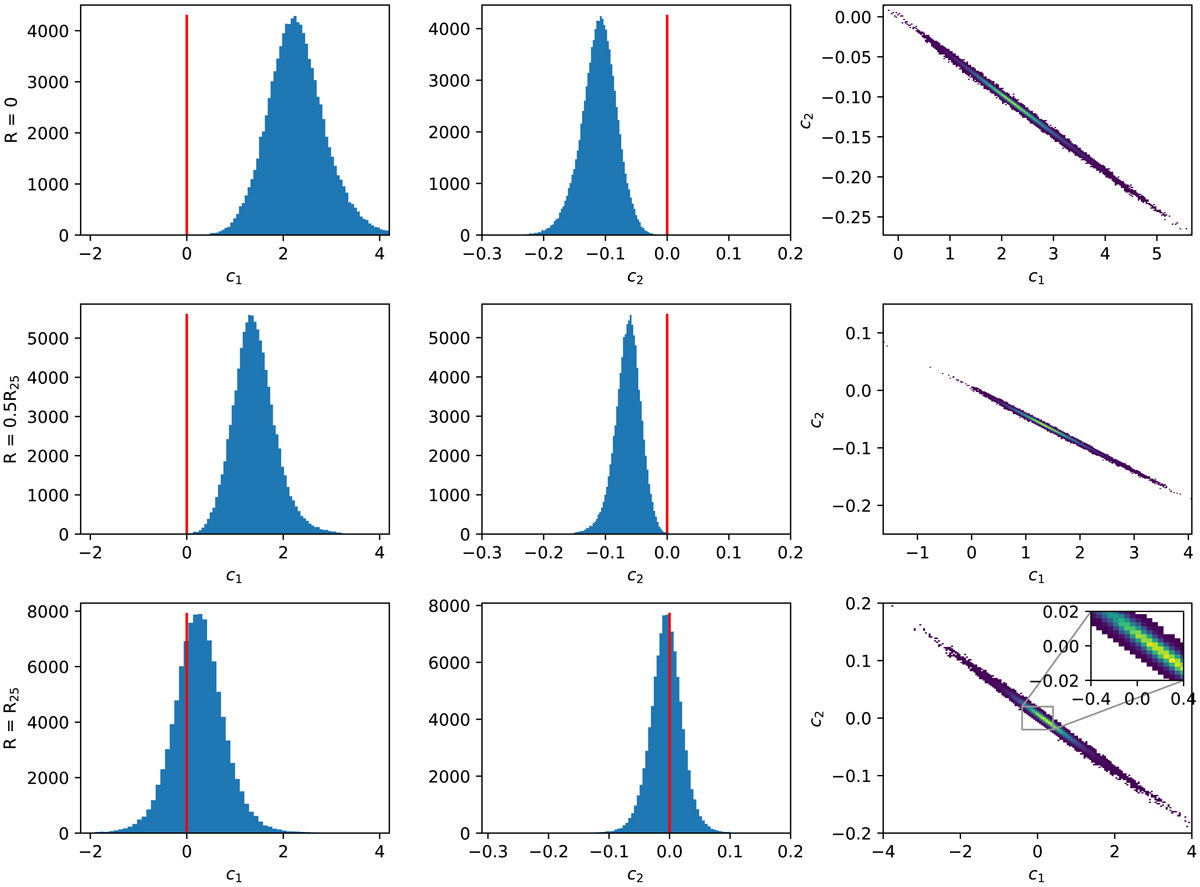
Probability distribution function for the c1 (left column) and c2 (middle column) coefficients of the generalized mass–metallicity relation in the center of galaxies (top panels), at R = 0.5R25 (middle panels), and R = R25 (bottom panels). The solid vertical line represents the zero value for each coefficient. The right column represents the correlation between the c1 and c2 coefficients.
Current usage metrics show cumulative count of Article Views (full-text article views including HTML views, PDF and ePub downloads, according to the available data) and Abstracts Views on Vision4Press platform.
Data correspond to usage on the plateform after 2015. The current usage metrics is available 48-96 hours after online publication and is updated daily on week days.
Initial download of the metrics may take a while.