Fig. 2.
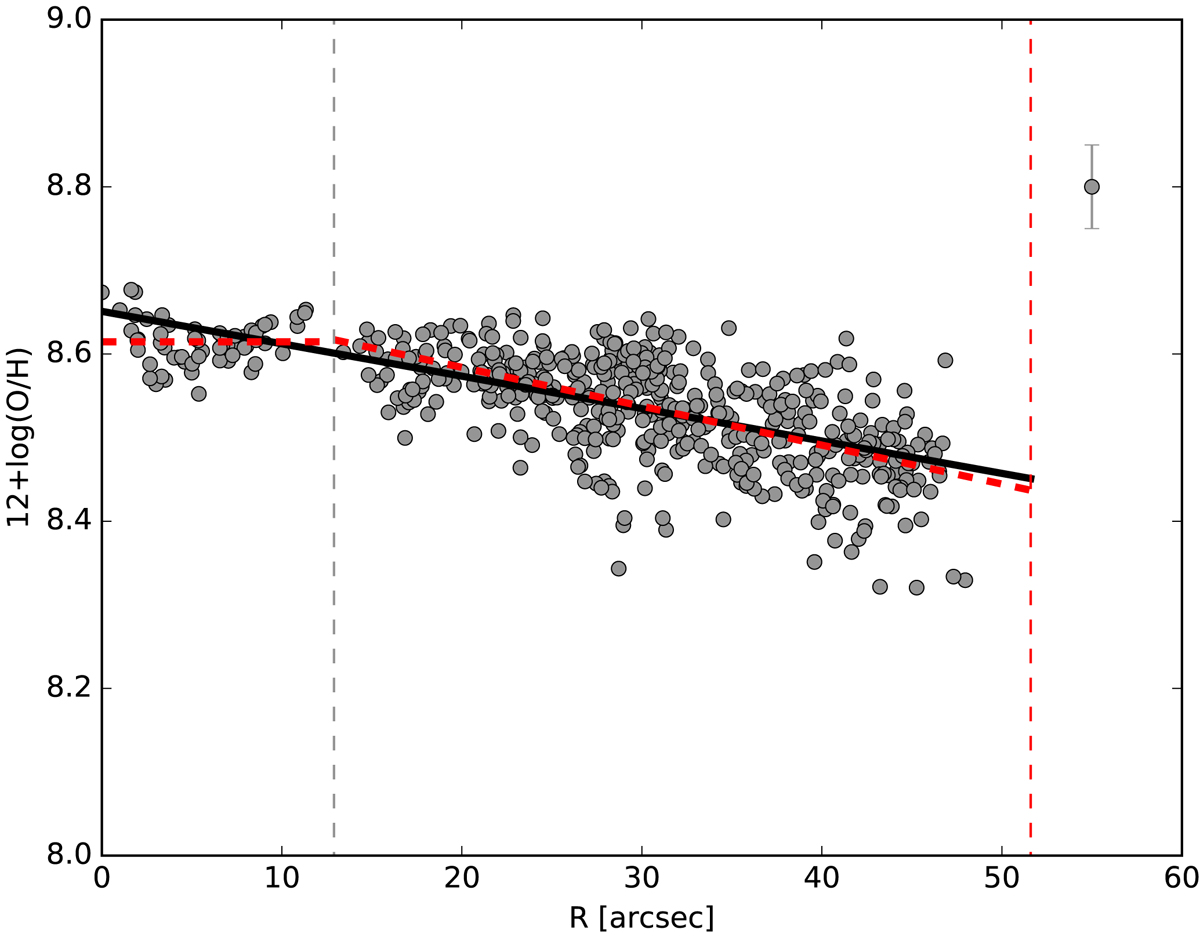
Oxygen abundance gradient for NGC 257. Circles represent the oxygen abundance in the individual spaxels. Vertical dashed lines represent 0.25 and 1.0 fraction of optical radius R25. The black solid line shows the best fit to all the data. Dashed red lines correspond to the best fit of the oxygen abundance gradient in the inner (R < 0.25R25) and outer (0.25R25 < R < R25) parts of the galaxy. The typical uncertainty of the oxygen abundance determination for the single spaxel is presented in the top right corner.
Current usage metrics show cumulative count of Article Views (full-text article views including HTML views, PDF and ePub downloads, according to the available data) and Abstracts Views on Vision4Press platform.
Data correspond to usage on the plateform after 2015. The current usage metrics is available 48-96 hours after online publication and is updated daily on week days.
Initial download of the metrics may take a while.