Fig. 1.
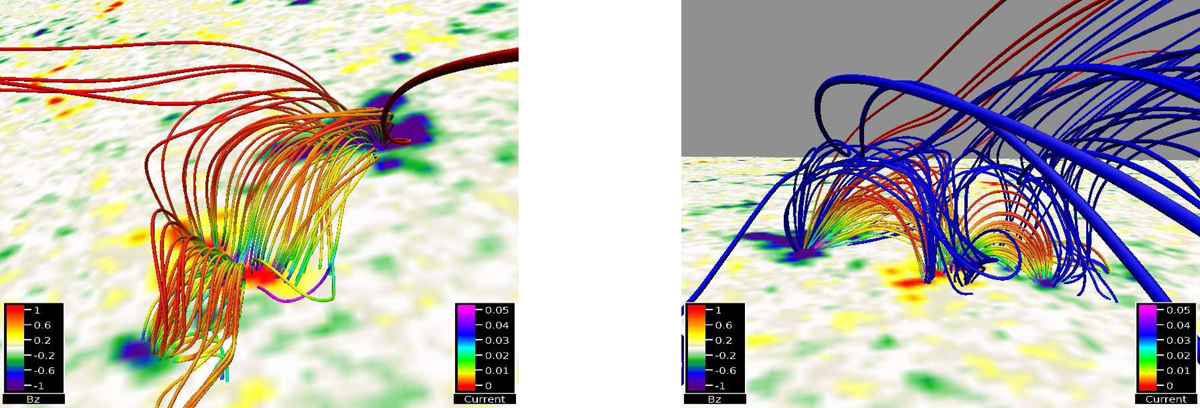
BP1–ER1. Left panel: loop structure of the BP1 region and the neighbouring smaller loop system that host the first observed eruption. The bottom plane represents the magnetogram scaled to ±85.3 Gauss. The field lines are colour-coded with a non-dimensional magnitude of the current. The current amplitude is in units of 0.0188 Amperes. The right panel: additionally includes the large-scale magnetic field (blue field lines) that embeds the loop systems seen in the left panel. Time: 22:39 UT. An animation (BP1_erupt1.mov) associated to the left panel is available online.
Current usage metrics show cumulative count of Article Views (full-text article views including HTML views, PDF and ePub downloads, according to the available data) and Abstracts Views on Vision4Press platform.
Data correspond to usage on the plateform after 2015. The current usage metrics is available 48-96 hours after online publication and is updated daily on week days.
Initial download of the metrics may take a while.