Fig. 6.
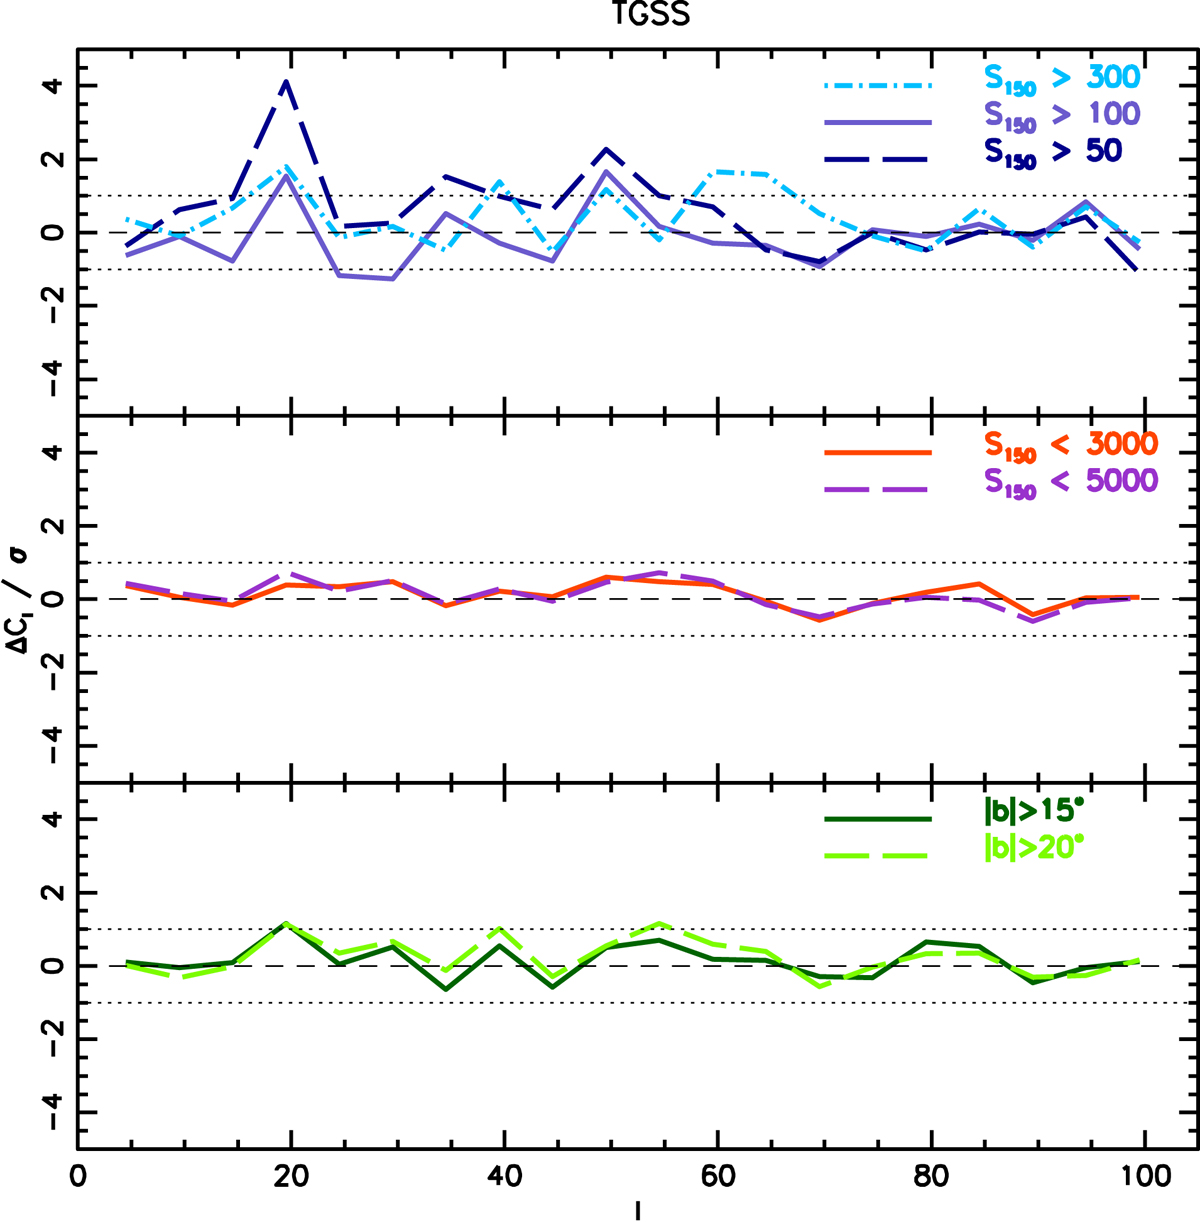
Angular power spectrum residuals of different TGSS samples with respect to the Reference case, expressed in units of Gaussian errors. Upper panel: normalized residuals of the TGSS samples selected at different values of the minimum flux cut, ![]() , indicated in the plot, compared to the Reference case of
, indicated in the plot, compared to the Reference case of ![]() . Middle panel: we consider samples selected at different values of the maximum flux cut,
. Middle panel: we consider samples selected at different values of the maximum flux cut, ![]() ; the Reference is
; the Reference is ![]() . Bottom panel: residuals for samples with different geometry masks, cut at different values of the Galactic latitude, also indicated in the plot, referred to the baseline case of |b|> 10°. The dotted horizontal lines in all panels indicate the 1σ Gaussian error of the Reference sample. The dashed horizontal line indicates the zero residual level.
. Bottom panel: residuals for samples with different geometry masks, cut at different values of the Galactic latitude, also indicated in the plot, referred to the baseline case of |b|> 10°. The dotted horizontal lines in all panels indicate the 1σ Gaussian error of the Reference sample. The dashed horizontal line indicates the zero residual level.
Current usage metrics show cumulative count of Article Views (full-text article views including HTML views, PDF and ePub downloads, according to the available data) and Abstracts Views on Vision4Press platform.
Data correspond to usage on the plateform after 2015. The current usage metrics is available 48-96 hours after online publication and is updated daily on week days.
Initial download of the metrics may take a while.