Free Access
Fig. 5.
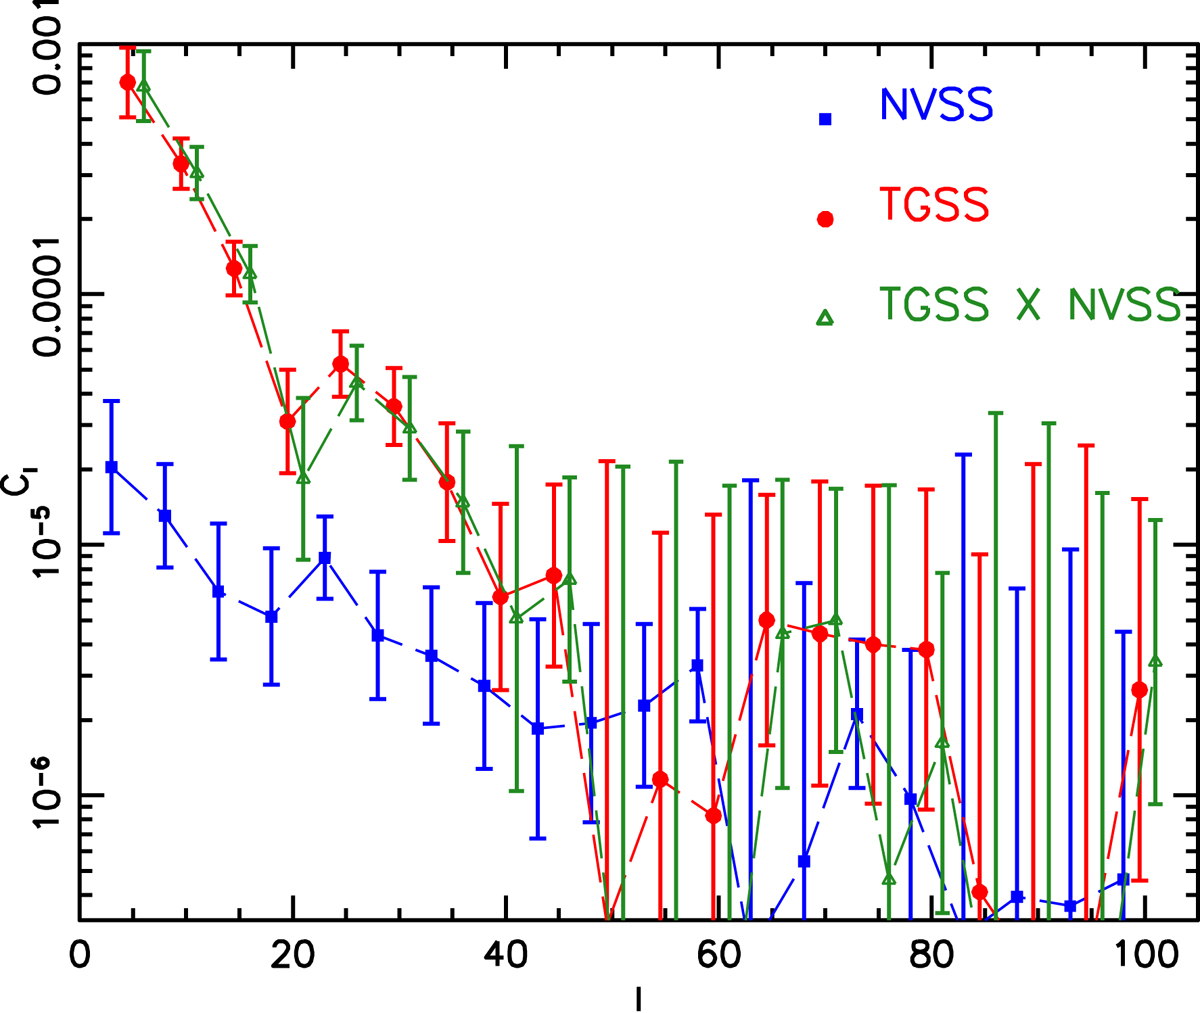
Angular power spectrum of the NVSS (blue squares) and TGSS (red dots) samples with Gaussian error bars. Small green triangles show the APS of the TGSS × NVSS matched catalog. All spectra are corrected for shot noise and multiple source contributions ΔCℓ.
Current usage metrics show cumulative count of Article Views (full-text article views including HTML views, PDF and ePub downloads, according to the available data) and Abstracts Views on Vision4Press platform.
Data correspond to usage on the plateform after 2015. The current usage metrics is available 48-96 hours after online publication and is updated daily on week days.
Initial download of the metrics may take a while.