Fig. 4.
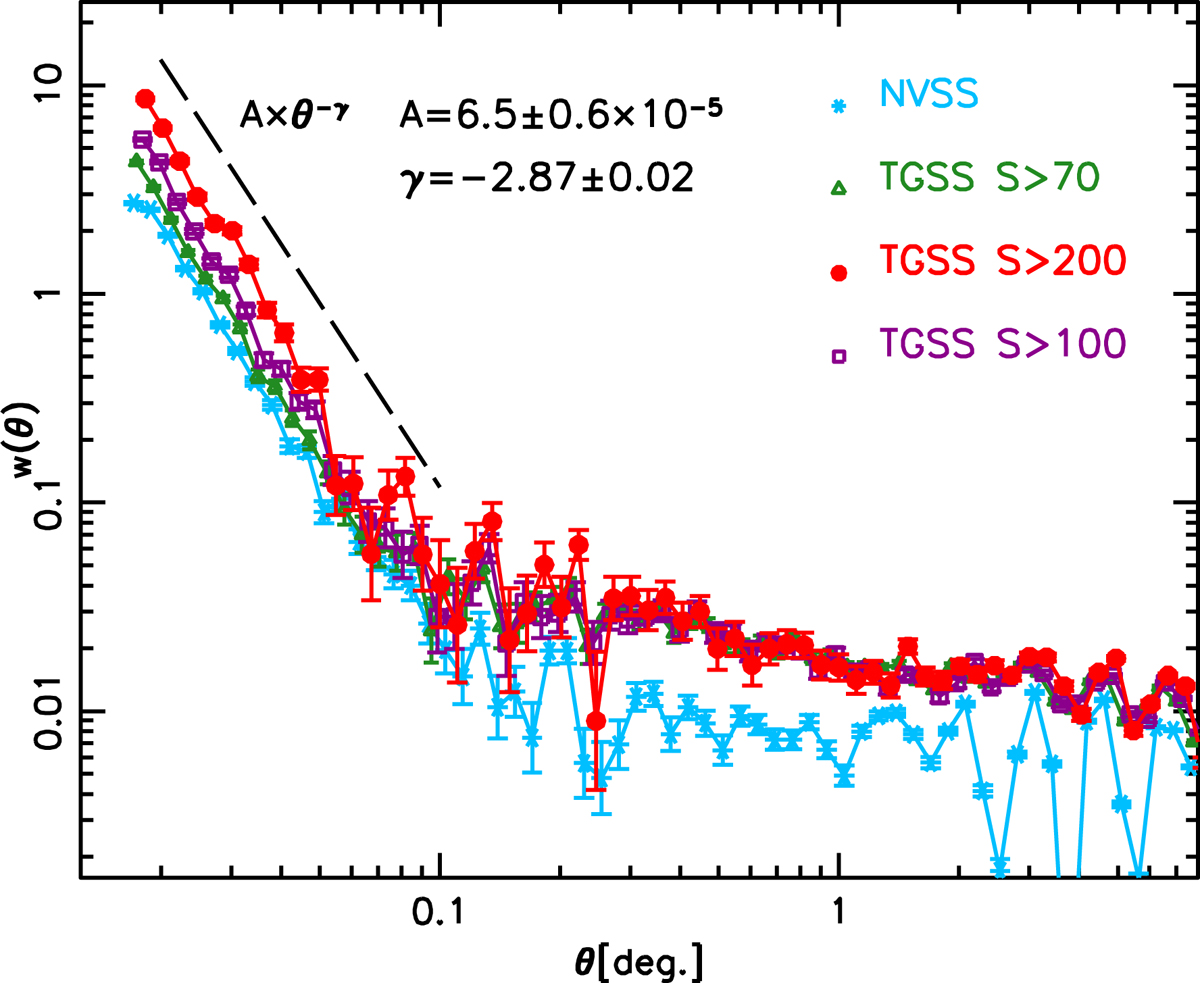
Angular two-point correlation function for the Reference TGSS (red dots) and NVSS (light blue asterisks) samples. Green triangles and purple squares represent the ACF of two additional TGSS subsamples selected at different flux cuts S150 > 70 mJy and S150 > 100 mJy, respectively. Error bars represent Poisson uncertainties. The black dashed line shows the best-fit power law to the ACF of the reference sample at θ < 0.1°. A vertical offset has been applied to avoid overcrowding. The best fitting parameters are indicated in the plot.
Current usage metrics show cumulative count of Article Views (full-text article views including HTML views, PDF and ePub downloads, according to the available data) and Abstracts Views on Vision4Press platform.
Data correspond to usage on the plateform after 2015. The current usage metrics is available 48-96 hours after online publication and is updated daily on week days.
Initial download of the metrics may take a while.