Free Access
Fig. 2.
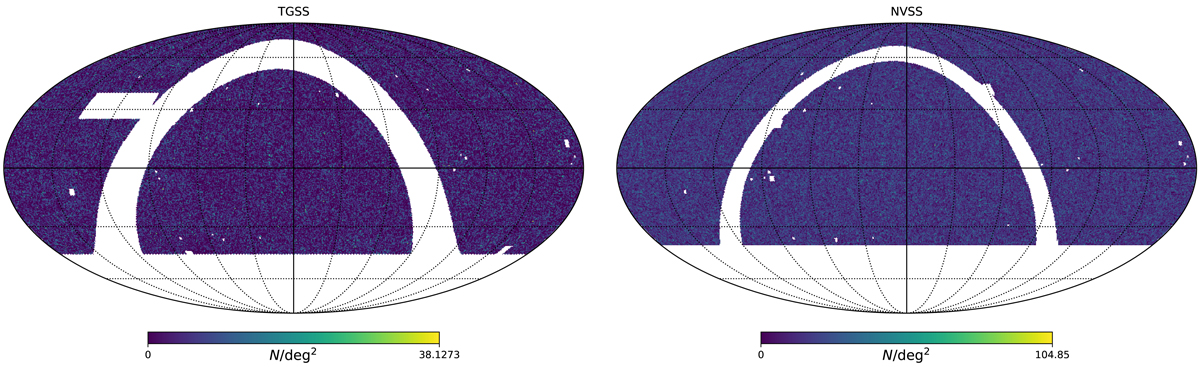
Mollweide projection of TGSS (left) and NVSS (right) samples in equatorial coordinates. The plots show reference catalogs with selection criteria described in the text. The color code in the bottom bar refers to N/deg2, denoting the number counts per deg2 in the pixel. The resolution of the map is Nside = 128.
Current usage metrics show cumulative count of Article Views (full-text article views including HTML views, PDF and ePub downloads, according to the available data) and Abstracts Views on Vision4Press platform.
Data correspond to usage on the plateform after 2015. The current usage metrics is available 48-96 hours after online publication and is updated daily on week days.
Initial download of the metrics may take a while.