Free Access
Fig. A.2.
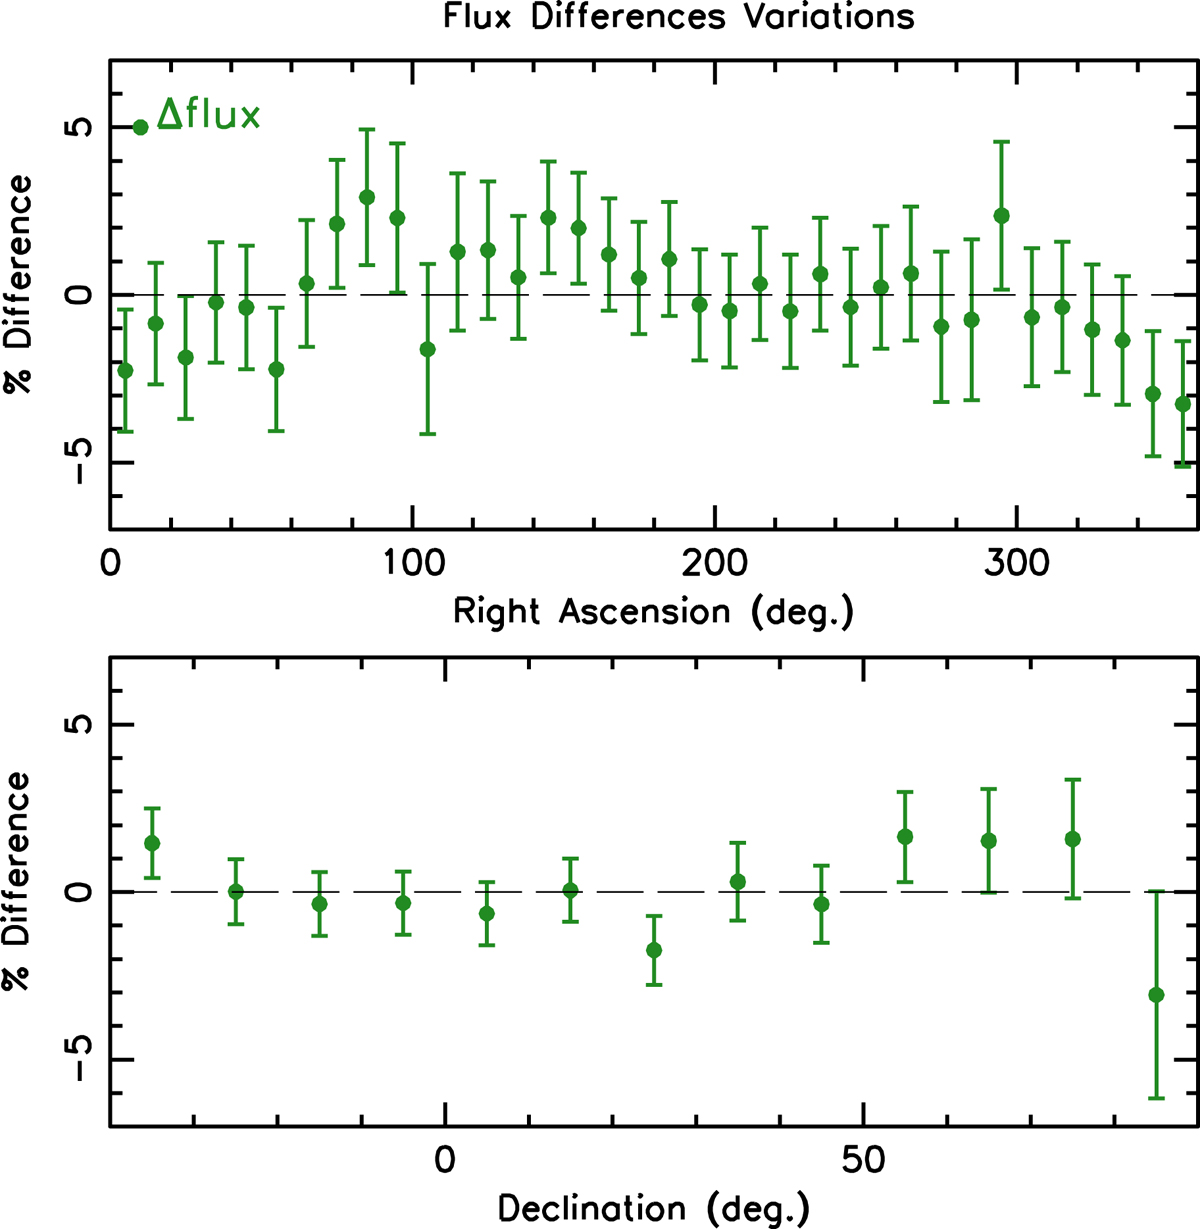
Percentage variations in the difference of TGSS-NVSS flux for all sources in the TGSS × NVSS catalog. The flux differences are computed as a function of the RA (top panel) and Dec (bottom panel). Error bars show the RMS scatter of the quantity estimated in the pixels of each RA and Dec stripe.
Current usage metrics show cumulative count of Article Views (full-text article views including HTML views, PDF and ePub downloads, according to the available data) and Abstracts Views on Vision4Press platform.
Data correspond to usage on the plateform after 2015. The current usage metrics is available 48-96 hours after online publication and is updated daily on week days.
Initial download of the metrics may take a while.