Fig. 1.
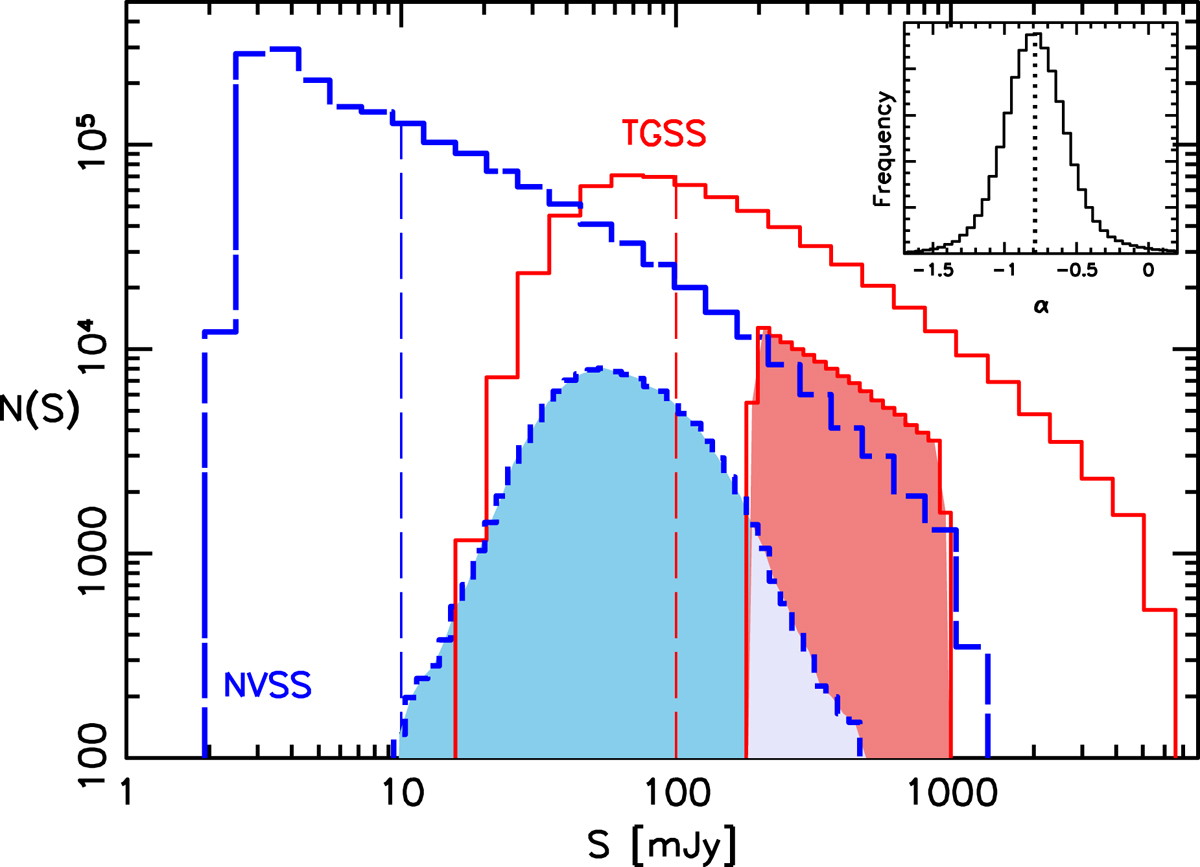
Source counts of the TGSS (red, continuous) and NVSS (blue, long-dashed) catalogs. The red shaded histogram on the right shows the number counts (in S150 flux unit) of the objects in the TGSS × NVSS catalog. The blue shaded area on the left shows the number counts (in S1.4 flux unit) of the same TGSS × NVSS objects. Dashed vertical lines indicate the lower flux thresholds assumed for the analysis presented in this paper. The histogram in the insert shows the distribution of the 150 MHz–1.4 GHz spectral index of the sources in the TGSS × NVSS catalog. The vertical dotted line indicates the peak of the distribution at α = −0.77.
Current usage metrics show cumulative count of Article Views (full-text article views including HTML views, PDF and ePub downloads, according to the available data) and Abstracts Views on Vision4Press platform.
Data correspond to usage on the plateform after 2015. The current usage metrics is available 48-96 hours after online publication and is updated daily on week days.
Initial download of the metrics may take a while.