Fig. 4.
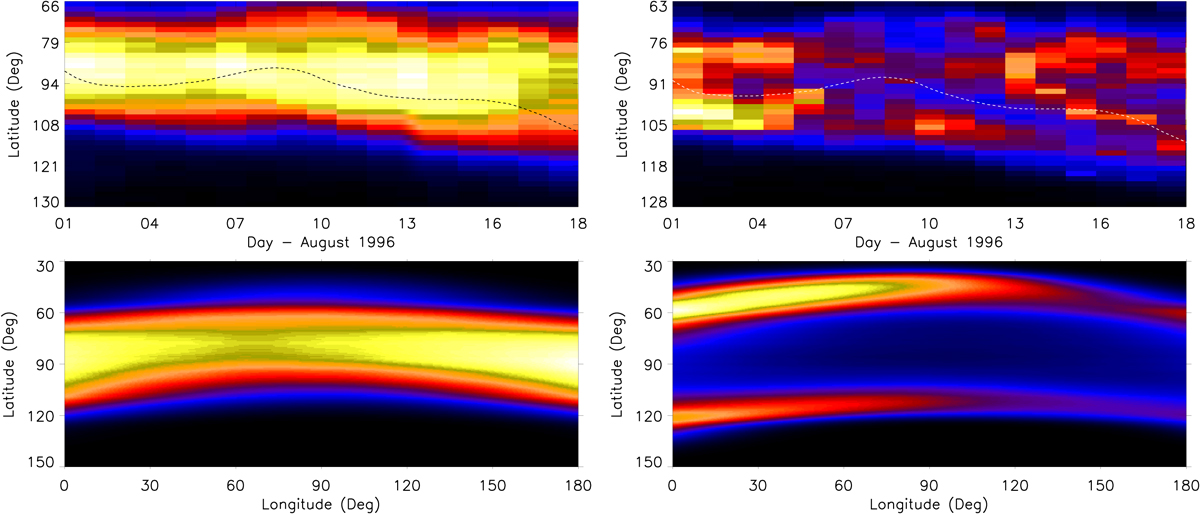
Top panel: Carrington maps (latitude as a function of longitude or time) of the intensities of HI Lyα (left panel) and OVI 1032 (right panel) spectral lines observed by UVCS in the period August 1–18, 1996 at 1.7 R⊙ (normalized units). The dotted black (left panel) or white (right panel) line shows the neutral line as computed by Wilcox Solar Observatory. Bottom panel: Carrington maps (latitude as a function of longitude) of the computed intensities from the model for the same spectral lines at 1.7 R⊙ (normalized units).
Current usage metrics show cumulative count of Article Views (full-text article views including HTML views, PDF and ePub downloads, according to the available data) and Abstracts Views on Vision4Press platform.
Data correspond to usage on the plateform after 2015. The current usage metrics is available 48-96 hours after online publication and is updated daily on week days.
Initial download of the metrics may take a while.