Fig. 5.
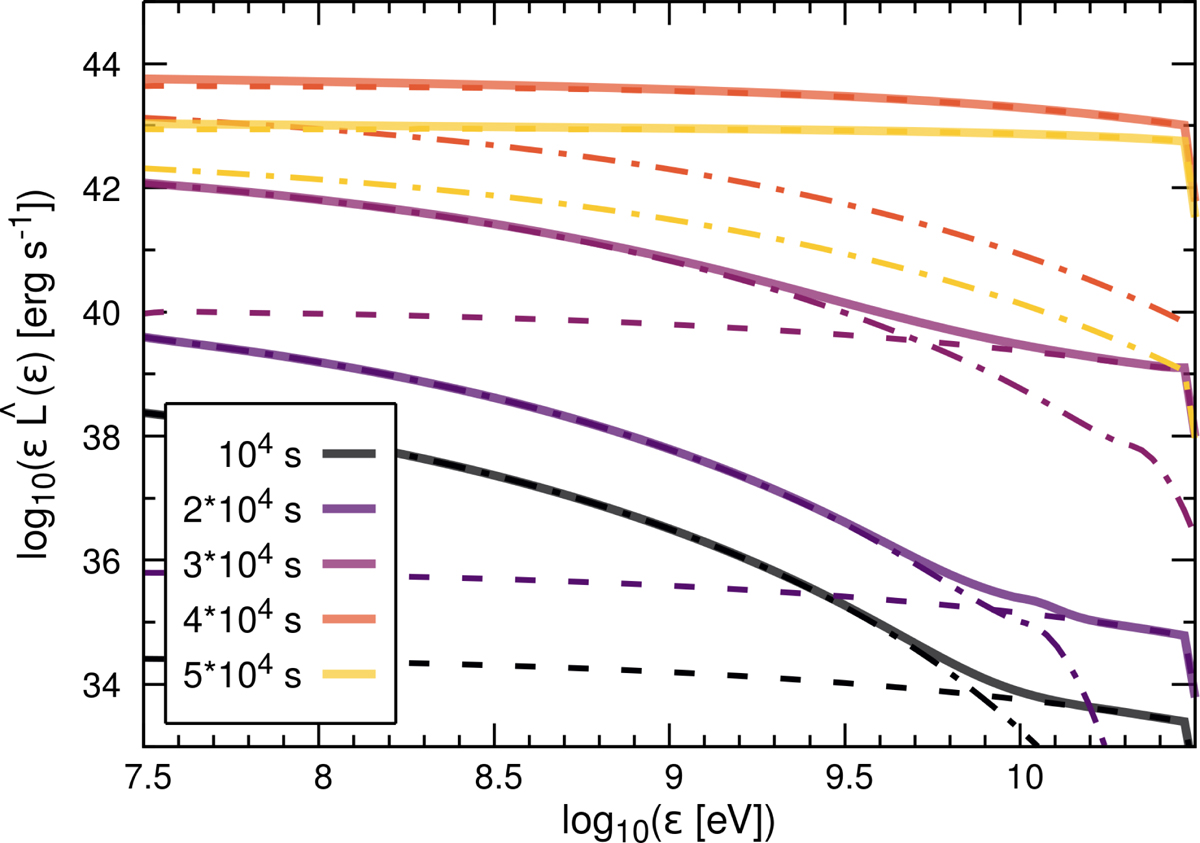
SEDs for different observing times. The dashed and dash-dotted lines represent the IC and synchrotron contribution, respectively, while the solid lines are the total emission. The emission increases with time until 4 × 10⁴ s, when it starts to decrease. The synchrotron emission dominates at energies < 10 GeV for early times, but IC dominates the whole SED above 0.1 GeV during the most luminous stages.
Current usage metrics show cumulative count of Article Views (full-text article views including HTML views, PDF and ePub downloads, according to the available data) and Abstracts Views on Vision4Press platform.
Data correspond to usage on the plateform after 2015. The current usage metrics is available 48-96 hours after online publication and is updated daily on week days.
Initial download of the metrics may take a while.